The circum-galactic medium is under intense scrutiny recently because of the role it is suspected to play in sustaining star-formation and the metal (anything heavier than Helium) content of galaxies.
There are a bunch of different approaches to the question of the balance within a galaxy: one can map various species in the galaxy using spectroscopy, one can look for absorption features in ultraviolet spectra (see Tumlinson+ 2017) and one can look for gas directly. The absorption route is popular in the US, the direct observation of cold gas is more of a European/South African thing. It depends on which telescope you have most likely access to.
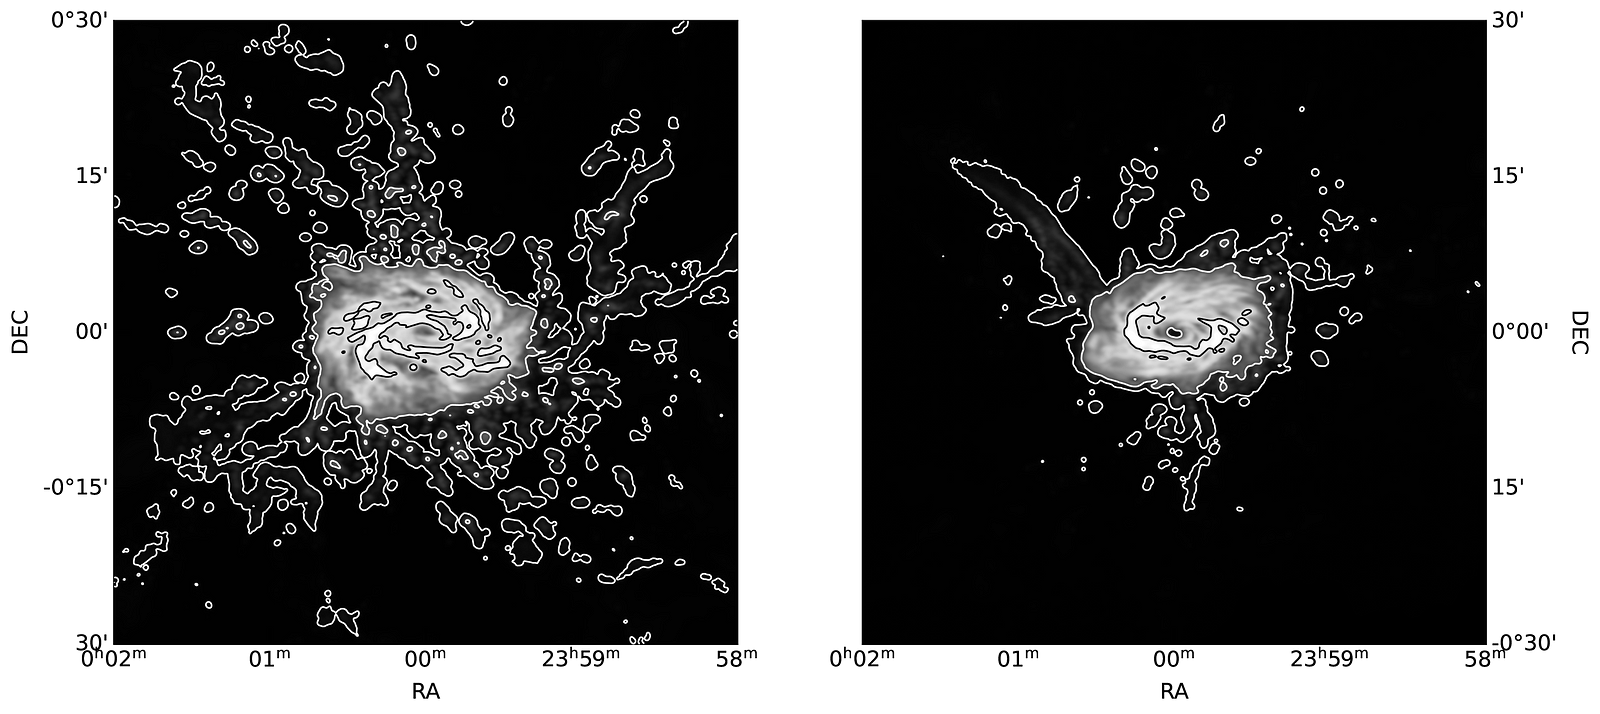
This paper uses a simulation — TNG50 — to estimate how to stack the 21cm HI atomic hydrogen line signal around nearby galaxies. There is an extensive argument on how to account for any motion before stacking. Here is the map of where one can expect HI (in TNG50 again):
The 21cm HI atomic hydrogen map of two TNG galaxies.
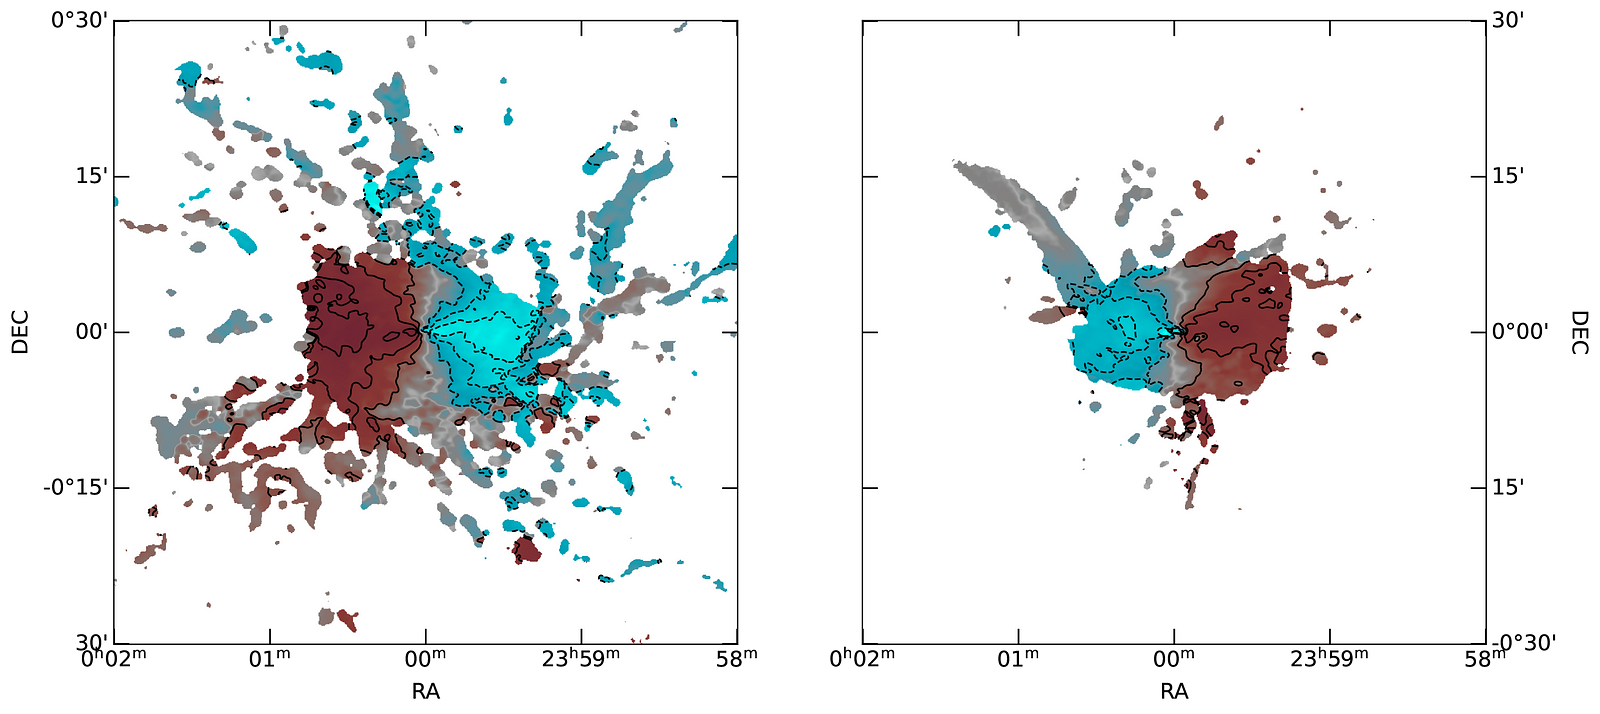
And this is the motion of that gas in the same two galaxies:
The velocity map of the two TNG galaxies. Both are rotating and given the side of the galaxy it is on, that rotation is a reasonable prior for any stacking of the small stuff on the outskirts which is probably not directly detected in observations.
So the models show how one could stack using the motion of the galaxy itself as a prior: there is a receding and approaching side and one can extrapolate how much redshift correction one should apply before stacking the spectra into a single spectrum.
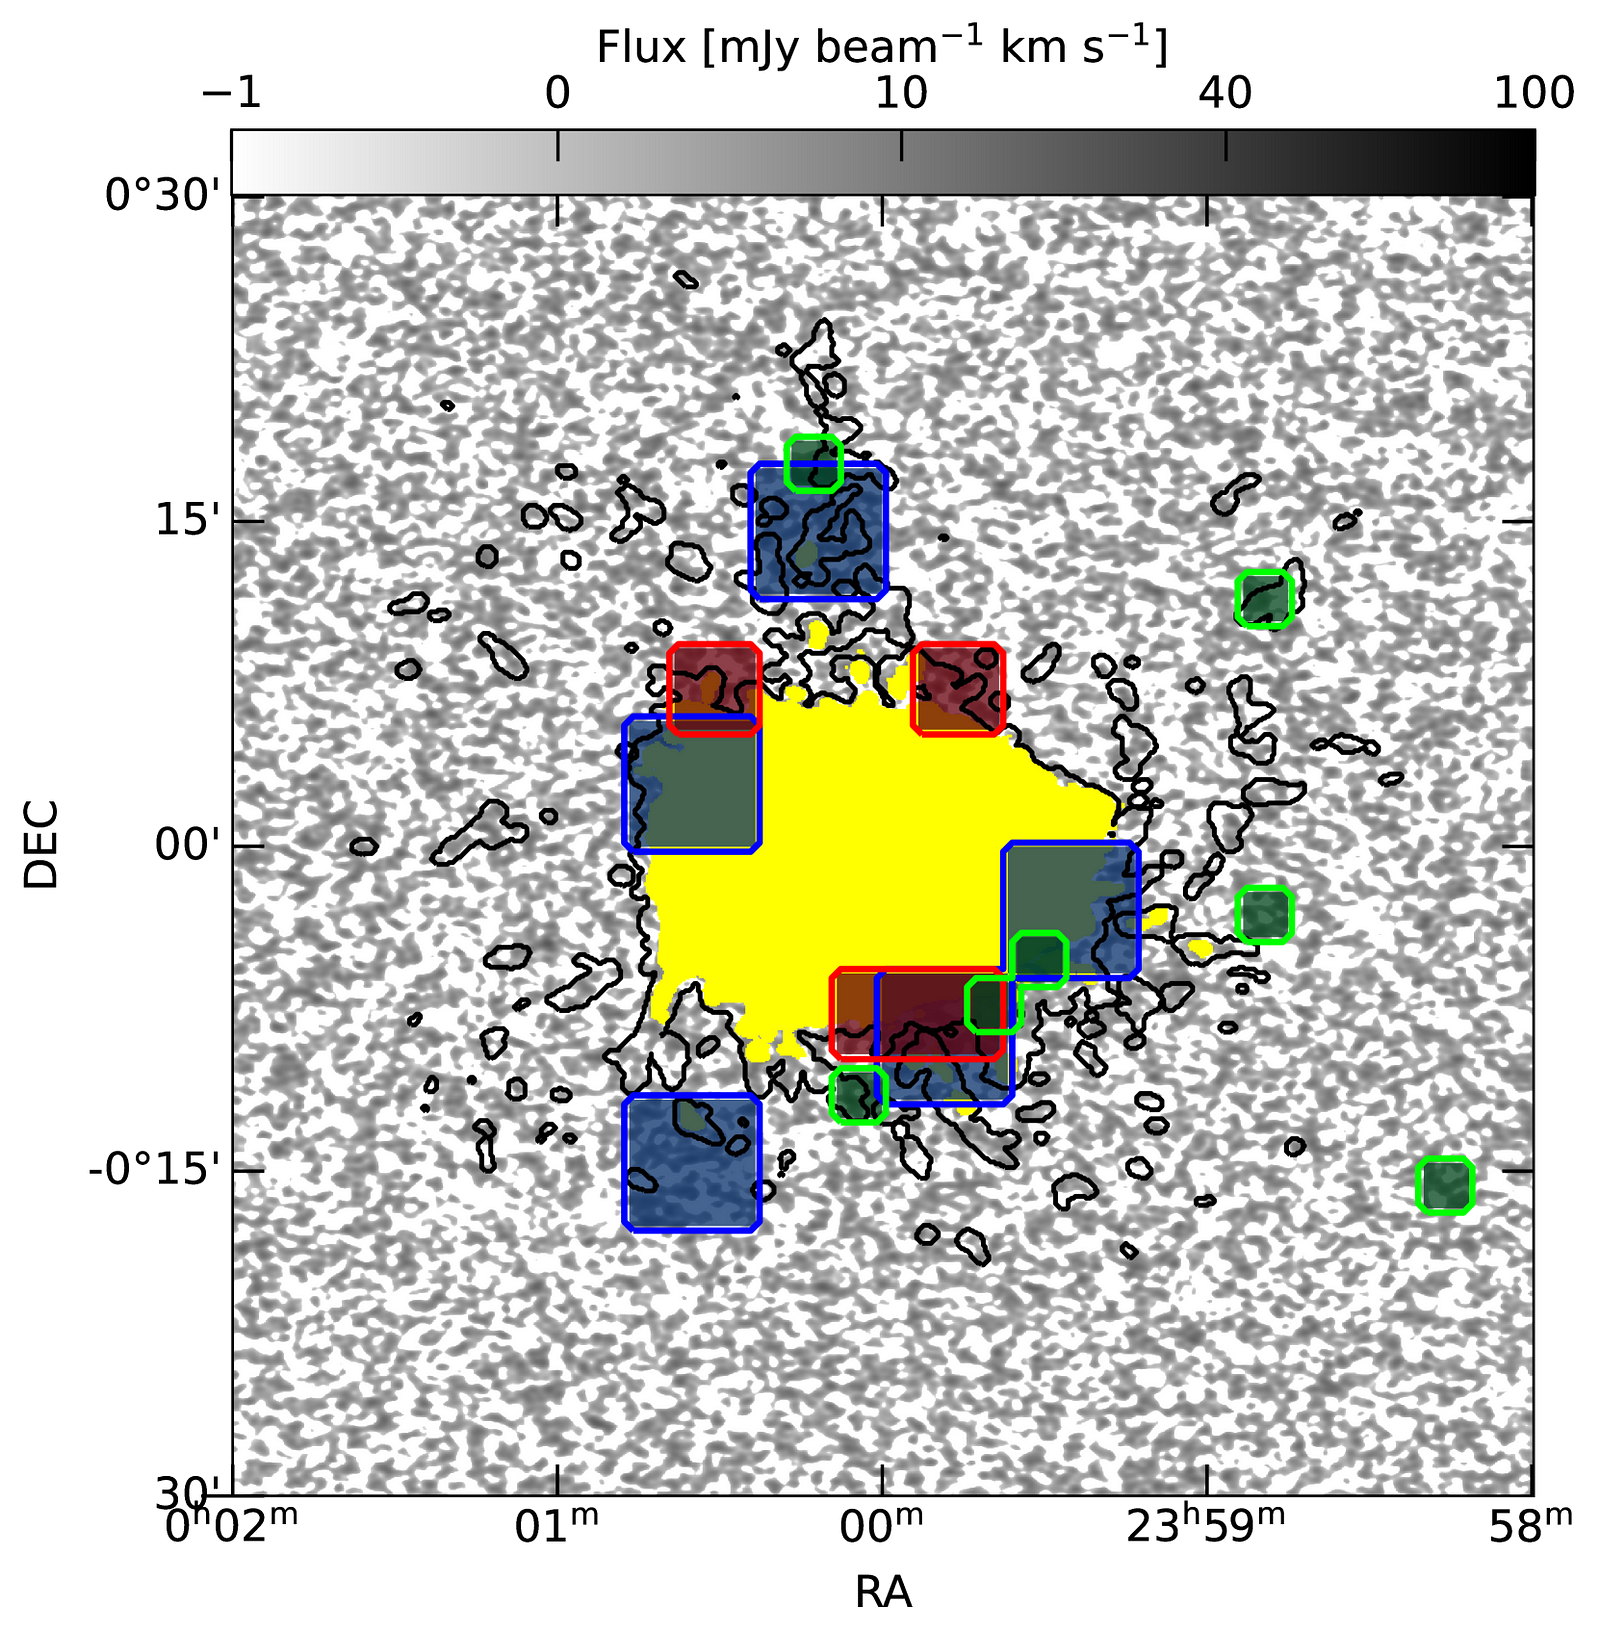
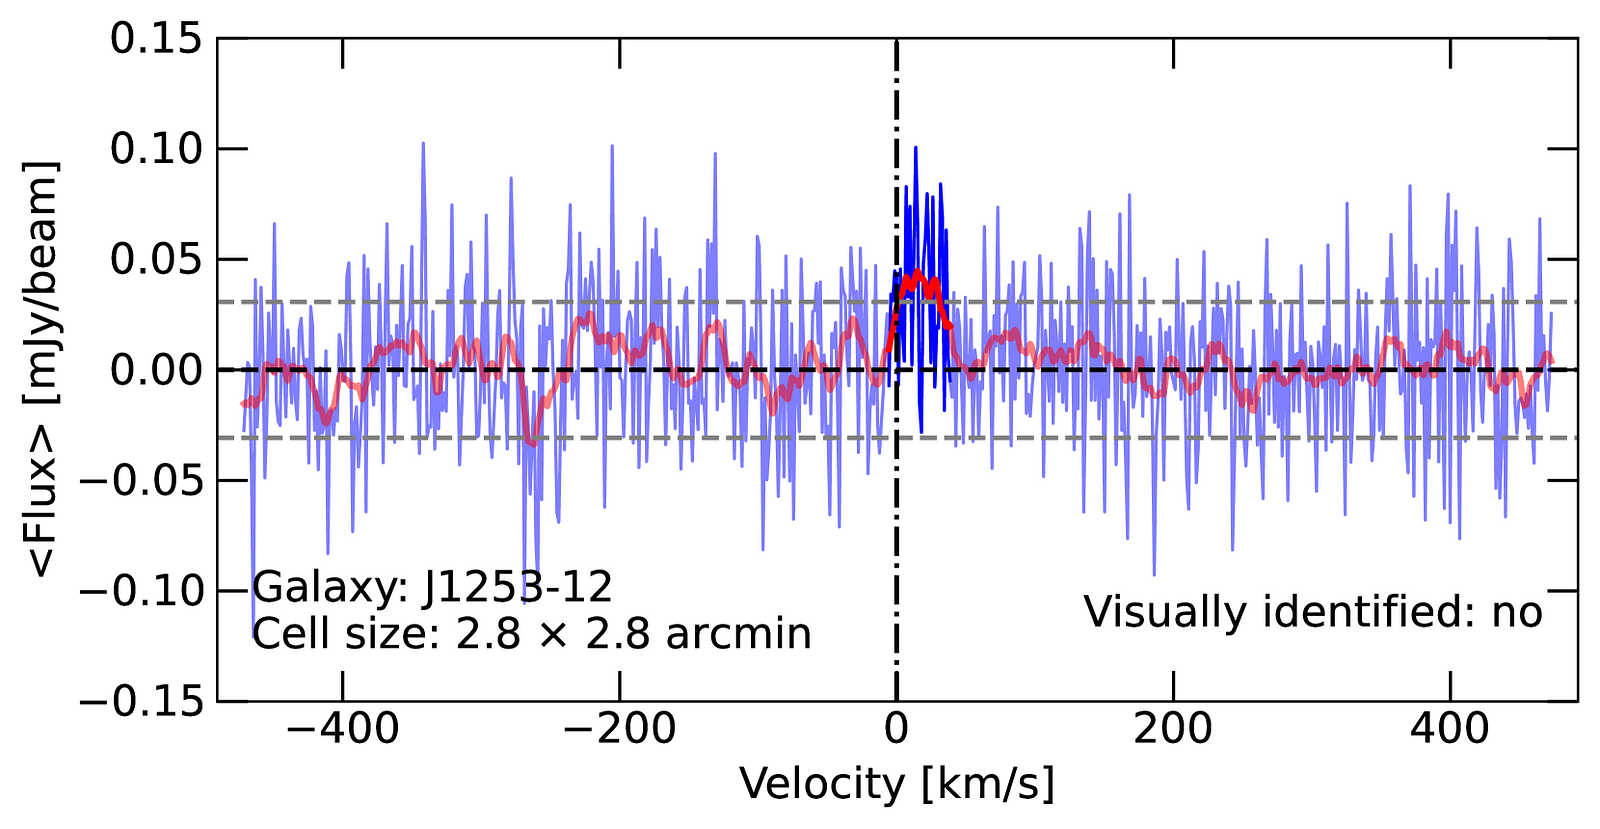
A TNG galaxy with identified areas for stacking. A stacked spectrum. One can classify stacked spectra as either visually visible in the cube or not even visible as a signal in the cube, only in the stacked spectrum.
So equipped with this approach, the authors now stack where practical in the 18 MHONGOOSE galaxies already observed for this survey. This is not the full sample but it is about half, a fair number.
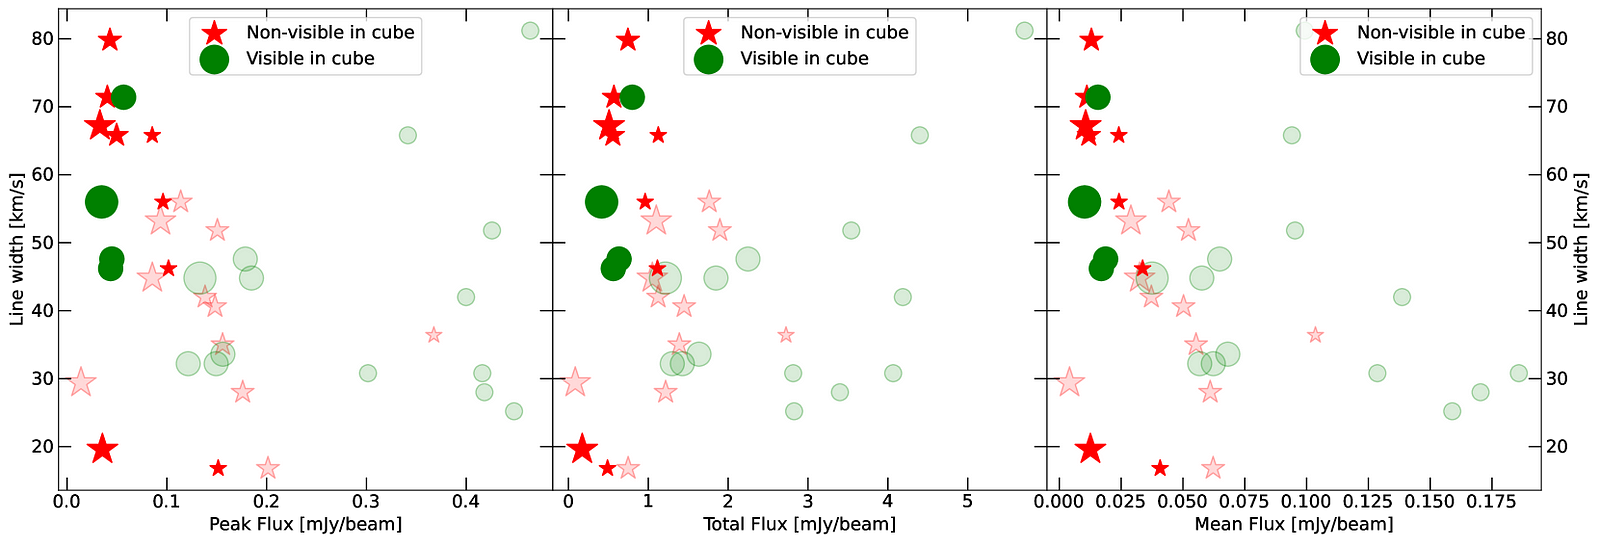
This is the stacked spectrum detections and their properties. Both visible and non-visible stacks work out fine. The issue is that there are not as many easily stacked images. There is not that much signal outside these disks!
The line properties of stacked areas either visually identified in the cube or stacked without a hint in the cube.
This is bad news for deep HI surveys. The hope was that the cold gas refueling nearby galaxies could be mapped with 21cm and further examined. As it stands, deeper observations will not reveal that much more 21cm line signal in ever more diffuse disks; at those column densities, the gas is ionized.
This remains to be seen but I think it makes a good case that just hammering away blindly to get deeper 21cm obervations on single galaxies is maybe not the best approach. Spreading the observing time around a sample is a much better use of the time. It really validates the MHONGOOSE choice of depth and trade-off between depth and sample size.
More to come of course. How much gas galaxies are receiving from their IGM remains a big unknown.
If there is one galaxy story from JWST that has caught the news, it’s all the big galaxies at high redshift, forcing a rethink on how galaxies form in the very early Universe. If there a second story from JWST, it is how many galaxies have lots and lots of dust in them apparently in the epochs right after. This was not completely a surprise, the Madau plot already had the option that the lead up to cosmic noon (z=1–2), a lot of the star-formation is hidden by dust. But with JWST, we are really getting a handle on how much of it is hidden.
For example, dust is apparent in early galaxies. This is the point on D. Burgarella’s recent paper [astroph]. Or this recent paper by Tarasse [astroph]. And this week a paper came out on the hidden star-formation in galaxies at 2.5<z<3.5. Cheng et al [astroph]:
Unveiling the Dark Side of UV/Optical Bright Galaxies: Optically Thick Dust Absorption
This uses the CEERS observations of galaxies at this redshift to explore how many are dust-dominated and hiding star-formation.
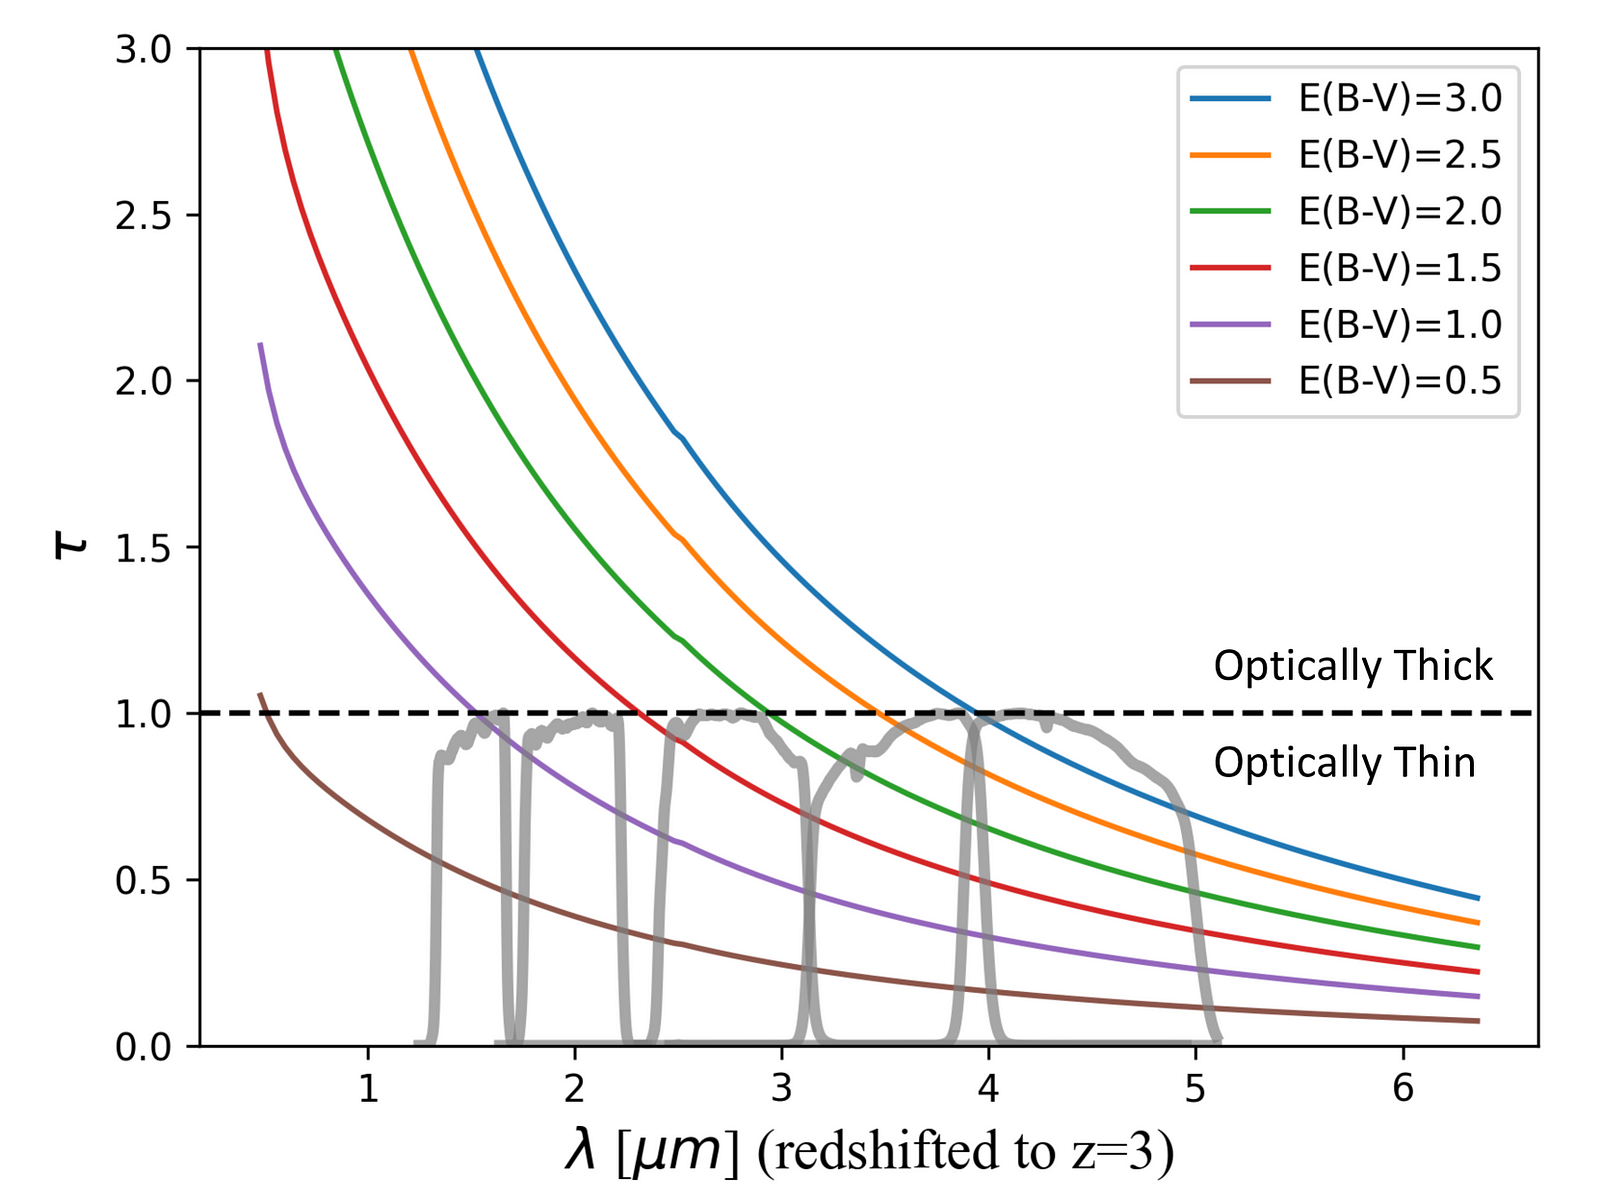
Quick primer: what does a certain amount of reddening look like in the JWST filters of CEERS at z=3? Note that there is an optically thick regime.
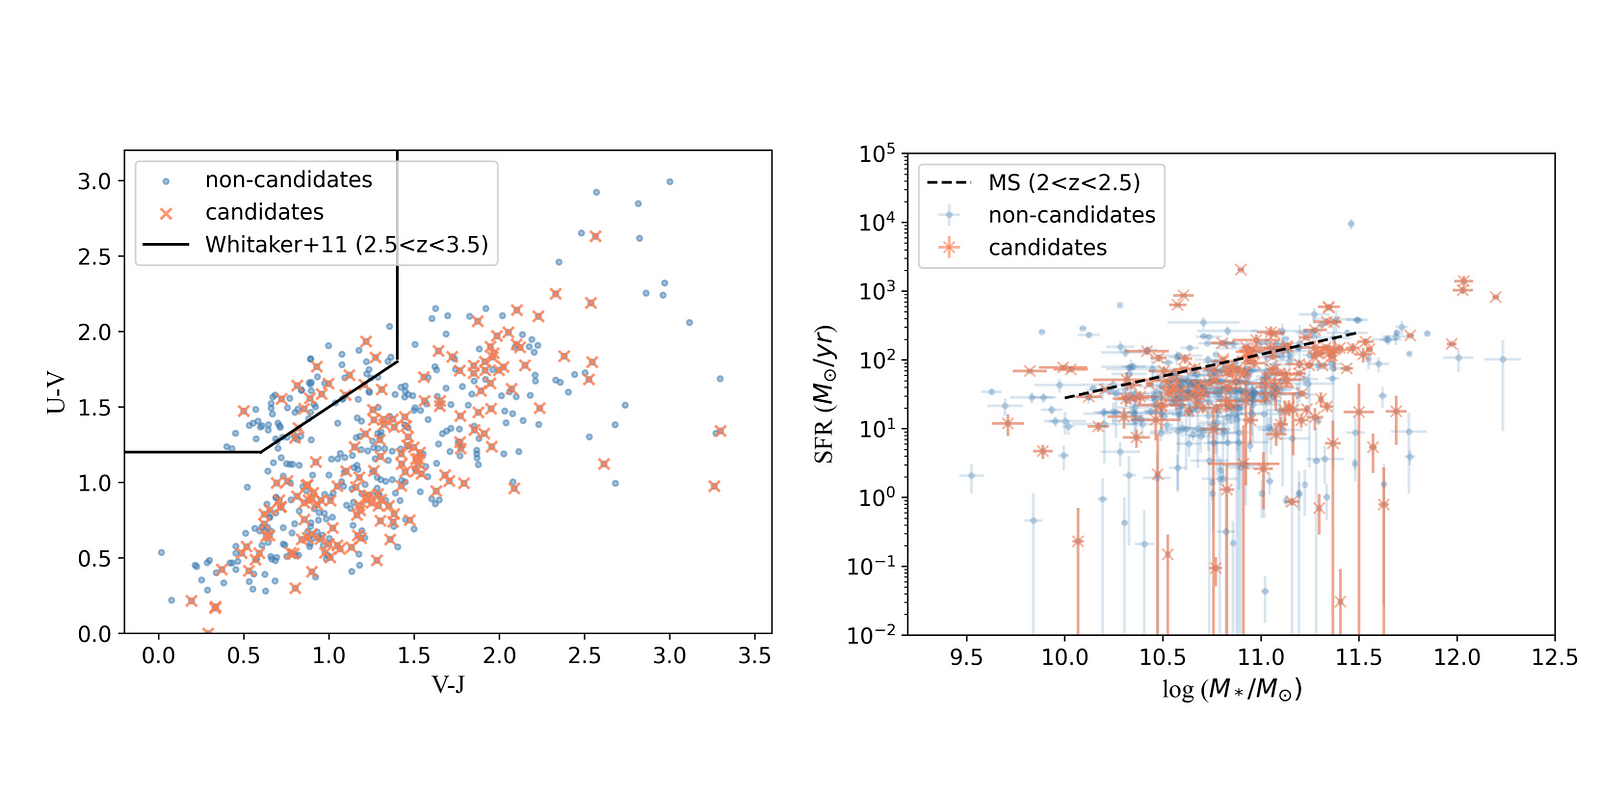
One can select objects that are candidate/not-a-candidate based on their SEDs and compare against the color-color diagram (the original way to select different galaxy populations) and the stellar-mass vs star-formation plot (with the *shudder* “main sequence”)
The candidate and not-a-candidate optically dark galaxies with rest-fram optical colors and the stellar mass and star-formation plot with the MS, the “star-forming galaxy main sequence”, a poor choice or term but we’re stuck with it now.
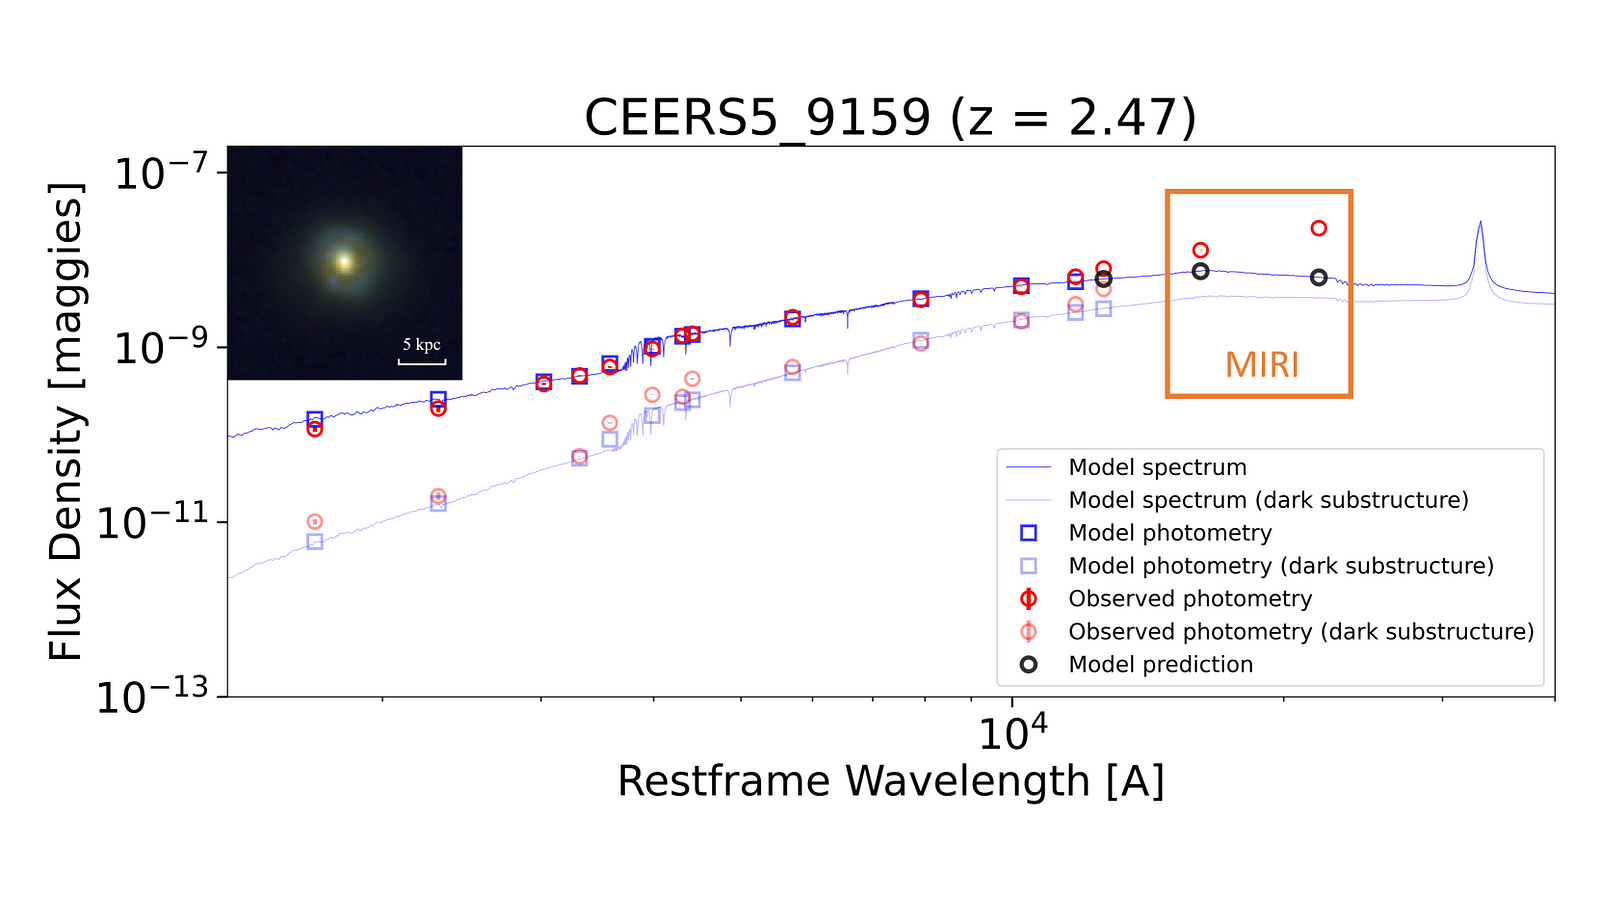
So how do the authors select candidates, by identifying galaxies with an excess in the longerst wavelength filter (F444W) compared to the SED. Below is an example SED with the MIRI contribution highlighted.
The interesting point here is the F444W just short of that. If there is more flux than expected, that is an indication there is radiation being reprocessed by dust inside this galaxy.
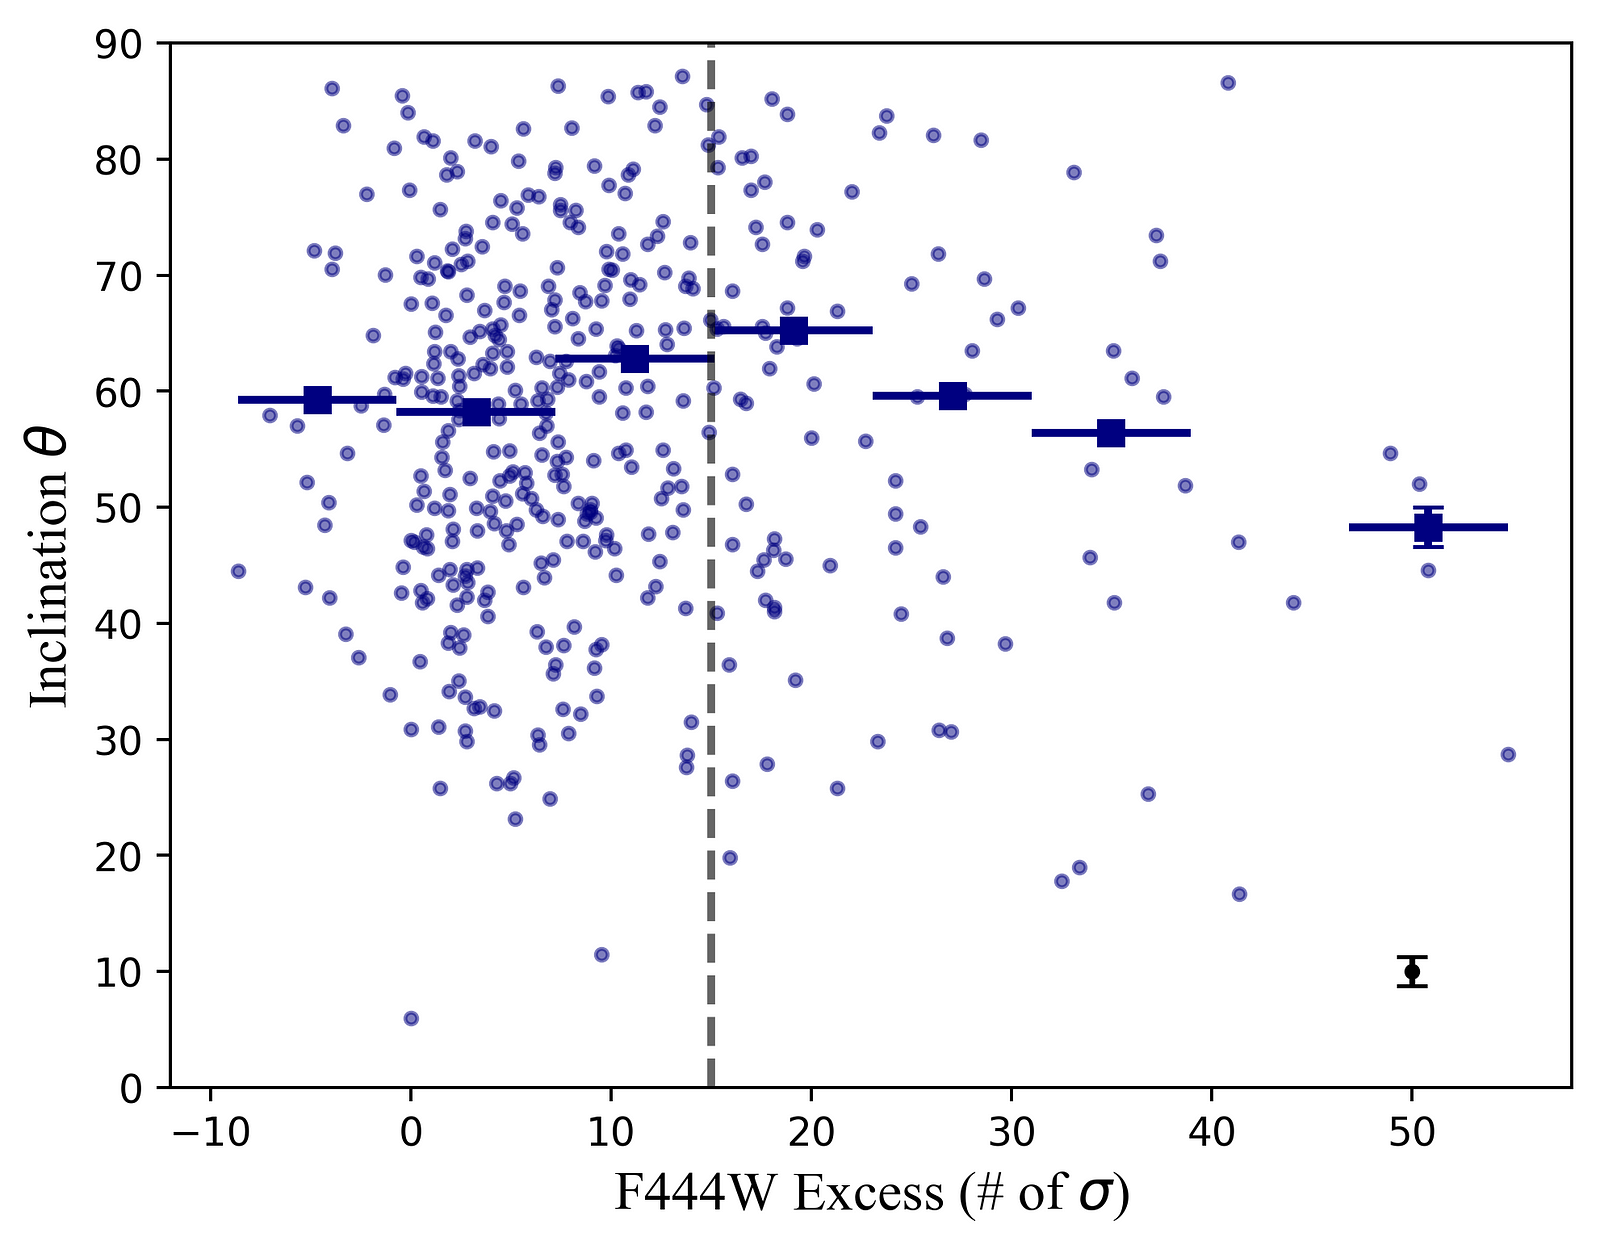
An example SED of a z=2.5 galaxy in CEERSOne of the sanity checks is to see if we are not looking at a disk edge-on. Easy to select for opaque disks in that case.
Now the results show that there is a sizeable fraction of star-formation that is obscured, not just dimmed, by star-formation at z>2. This is something we see in the local Universe, some 40% of disks is not transparent.
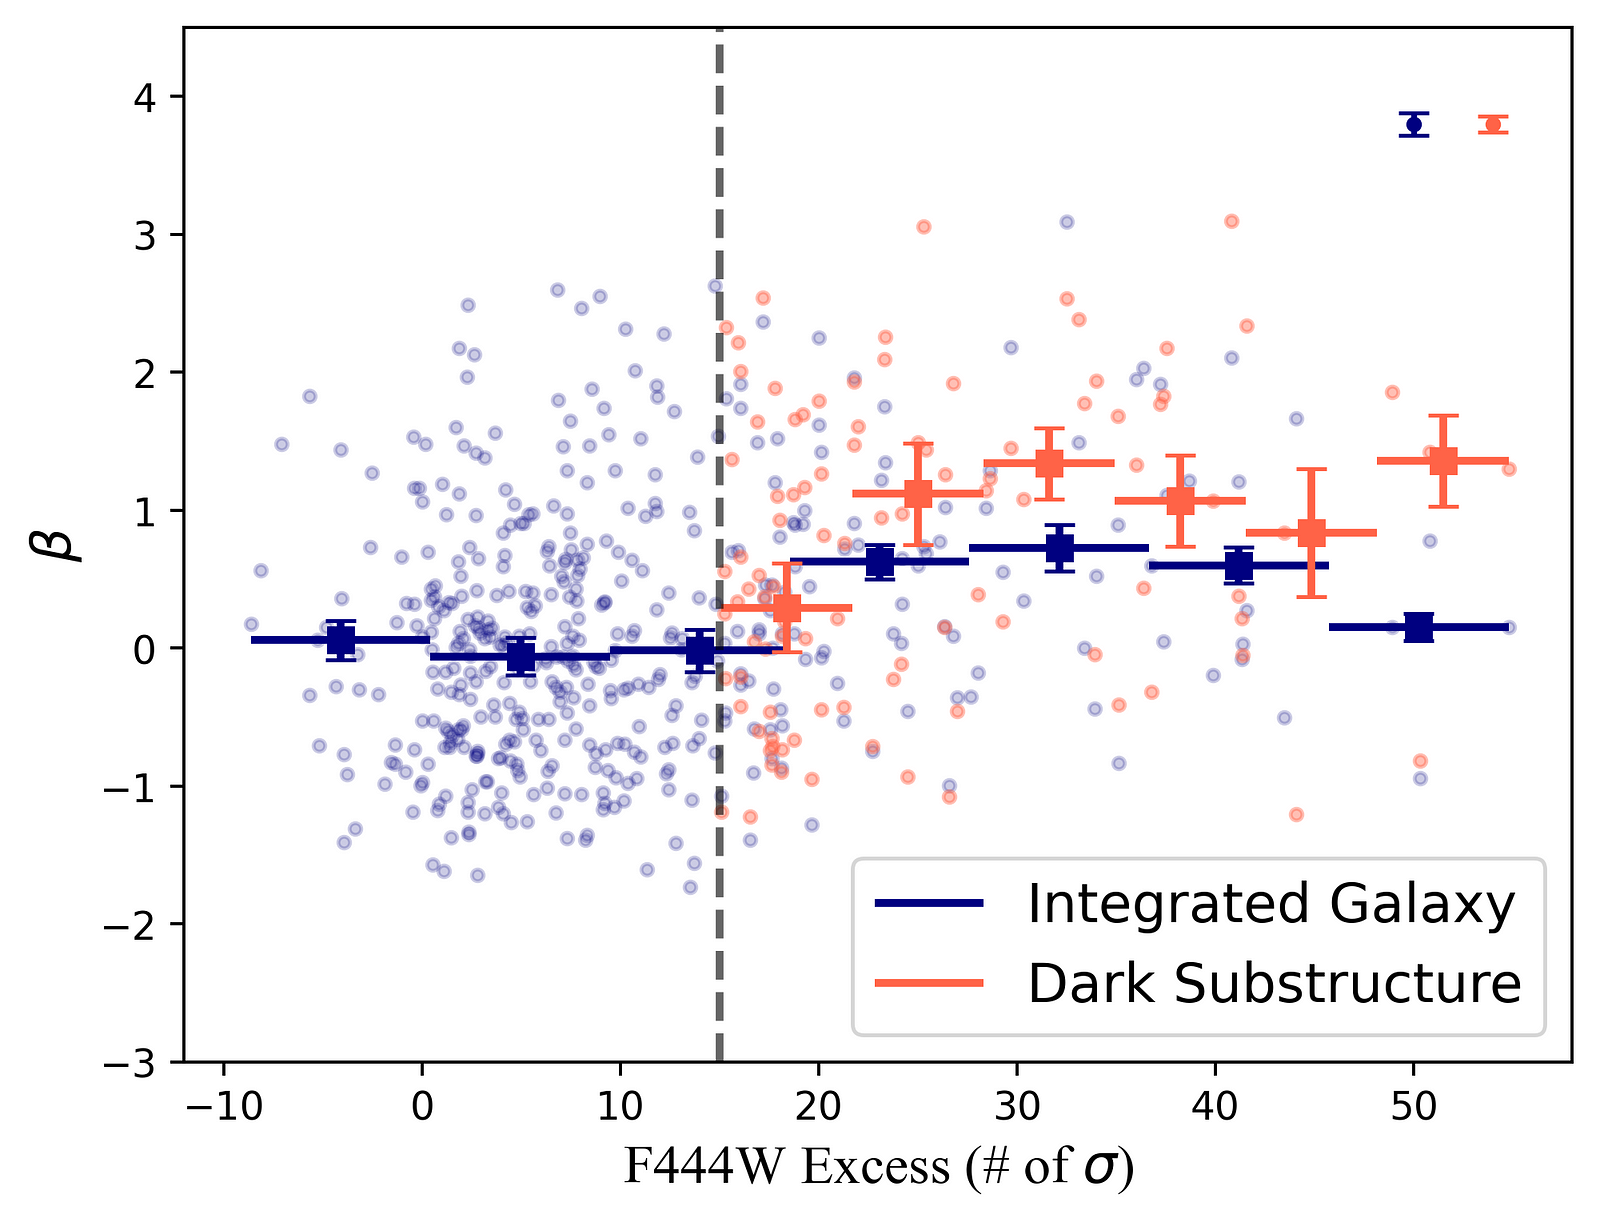
You can see that as well in the slope of the blue colors, beta.
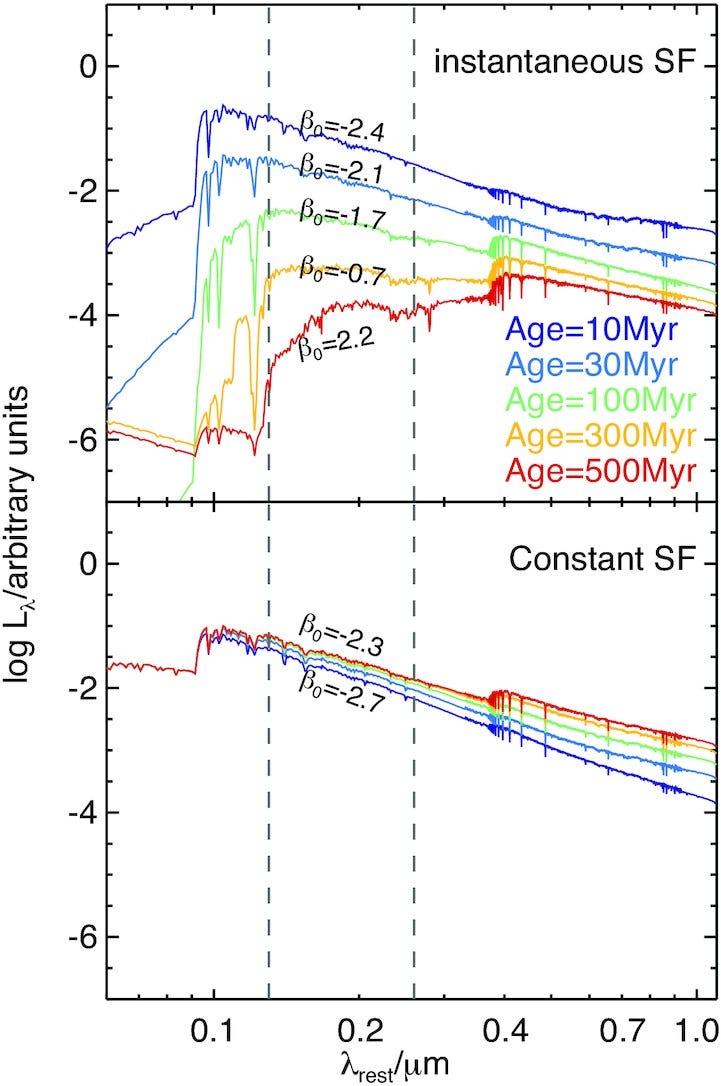
And just to remind myself which way beta goes again, here is the slopes for aging (therefore redder) populations from Qin+ 2022 [astroph]: negative means bluer. positive means redder. The obscured structures redden on average. This is the age/reddening degeneracy that plagues SED fitting.
Two examples from Qin+ 2022. Either a burst of star-formation ages ago or constant star-formation over the last 500 million years. As populations age, their blue/ultraviolet slope \beta becomes redder (positive).
Long story short: we see more and more obscured star-formation in galaxies; either in dust-obscured dwarfs galaxies, or part of galaxies (this paper), or even completely optically thick “dark galaxies” not detected with Hubble but now observed with JWST. The early Universe is a lot more dusty place than previously thought. Should be interesting to look at in the coming years.
Okay I have been tentatively dipping my curiosity into machine learning. I’m coming from a bit behind the curve because well… it’s got a learning curve and I have a day job. But I’ve been steady picking things up. But mostly, I have been noting where there are opportunities to check Machine Learning’s work. Maybe later a deeper survey came along and we can check ML predictions using traditional astronomy techniques we understand much better.
And that is where I have been putting some of my recent research. A little while ago I checked the XSAGA catalog, a prediction for objects that are below z<0.03 against the deeper GAMA spectroscopic sample. The overlap is much smaller than the XSAGA sample but it gives us a direct measure as to how well this ML technique did (well done John Wu, it was spot on where you predicted the effectiveness was). More about it in this paper in MNRAS (or astroph here).
So that was fun. But I wanted to talk about a second paper where I did a check of a ML prediction against more traditional astronomy. In this case a Galaxy Zoo comparison.
The Galaxy Zoo Catalogs for the Galaxy And Mass Assembly (GAMA) Survey
This started as a much more modest idea: we have two Galaxy Zoo catalogs on the equatorial GAMA fields, let’s compare the voting and make these catalogs public so they can be used by students. My main motivation was to generate something that could be used as a reference for students using the GAMA catalogs and make them easy to use by adding CATAID column to them.
The three GAMA fields that seemed to be included in DESI, for which there is a GZ catalog from Walmsley+ (2023).
All well and good and I started comparing voting fractions across both the catalog originally made for the GAMA collaboration, using KiDS imaging and voting from the Galaxy Zoo citizen scientists.
But on closer inspection, the Walmsley+ (2023, astroph) catalog only includes voting fractions! And those are from the ZooBot machine learning algorithm that is trained on early voting and then helps with predictions for the rest of the survey. This is a necessary step as voting on the full survey would take too long. So instead of an A/B test of surveys (KiDS imaging vs DESI), it also became a comparison of Galaxy Zoo voting from people and voting according to people+ZooBot!
Fortunately, the questions had remained the same between the KiDS Galaxy Zoo effort and the DESI Galaxy Zoo (+ZooBot) effort. Well mostly. The question tree looked like this:
The Galaxy Zoo question tree. All volunteers start at the top with Question T00.
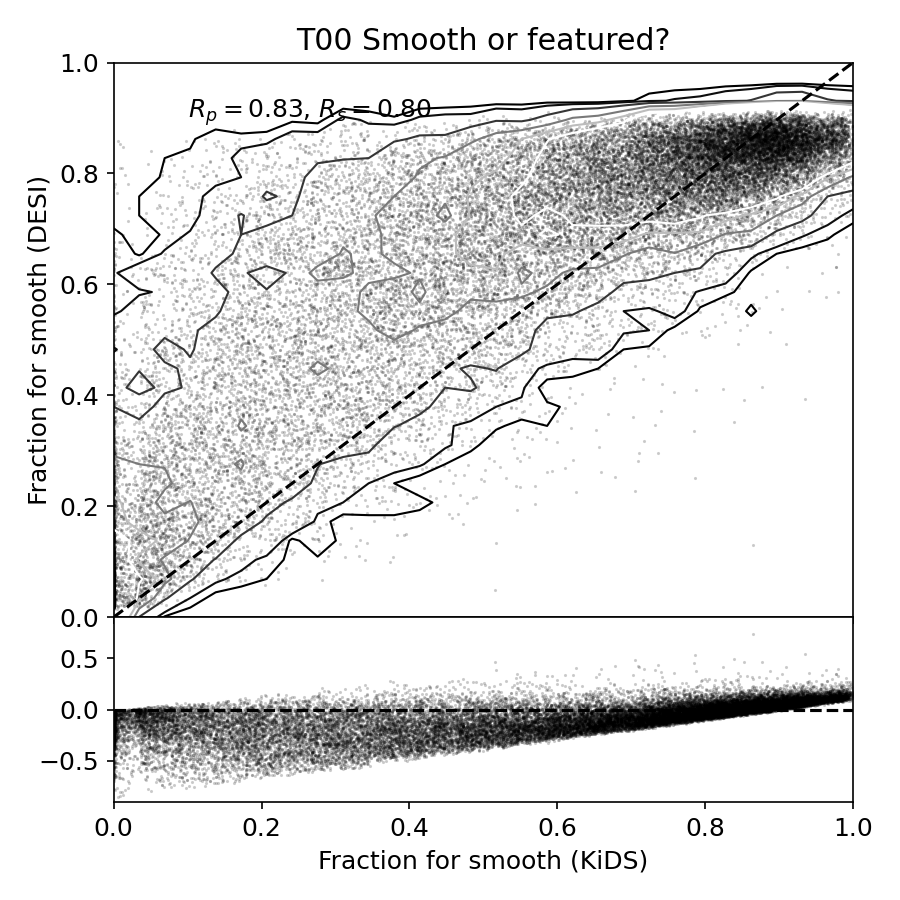
The main difference is in the very first question. The DESI voting (and the ZooBot trained on those) seem to vote more for smooth galaxies, than one with features. Why would that be?
Galaxy Zoo voting for KiDS (x-axis) and the fraction in favor of ``smooth galaxy’’ in the DESI survey, including ZooBot predictions.
The difference is depth: the DESI survey is much shallower than KiDS, by design, to get more of the sky. But that means dim features surrounding a bulge, e.g. a disk with spiral arms, will not be as readily visible.
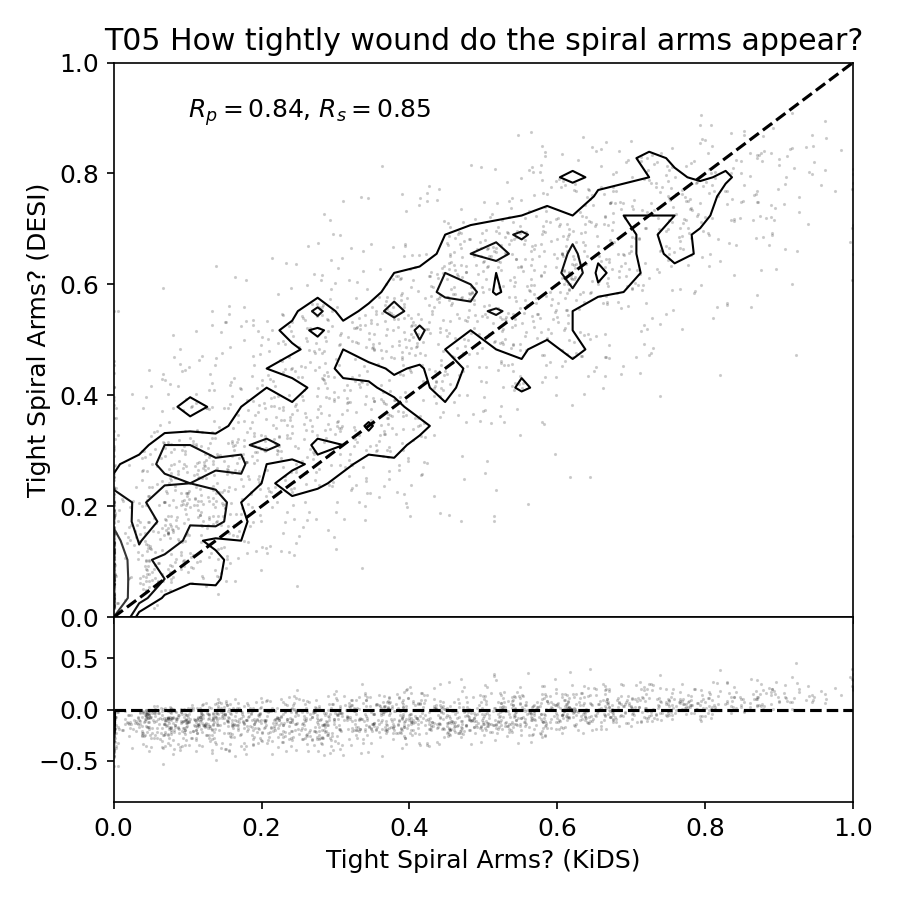
But once DESI Galaxy Zoo (+ ZooBot) can detect a galaxy with features, the voting agrees with each other! How tightly wound are the spiral arms?
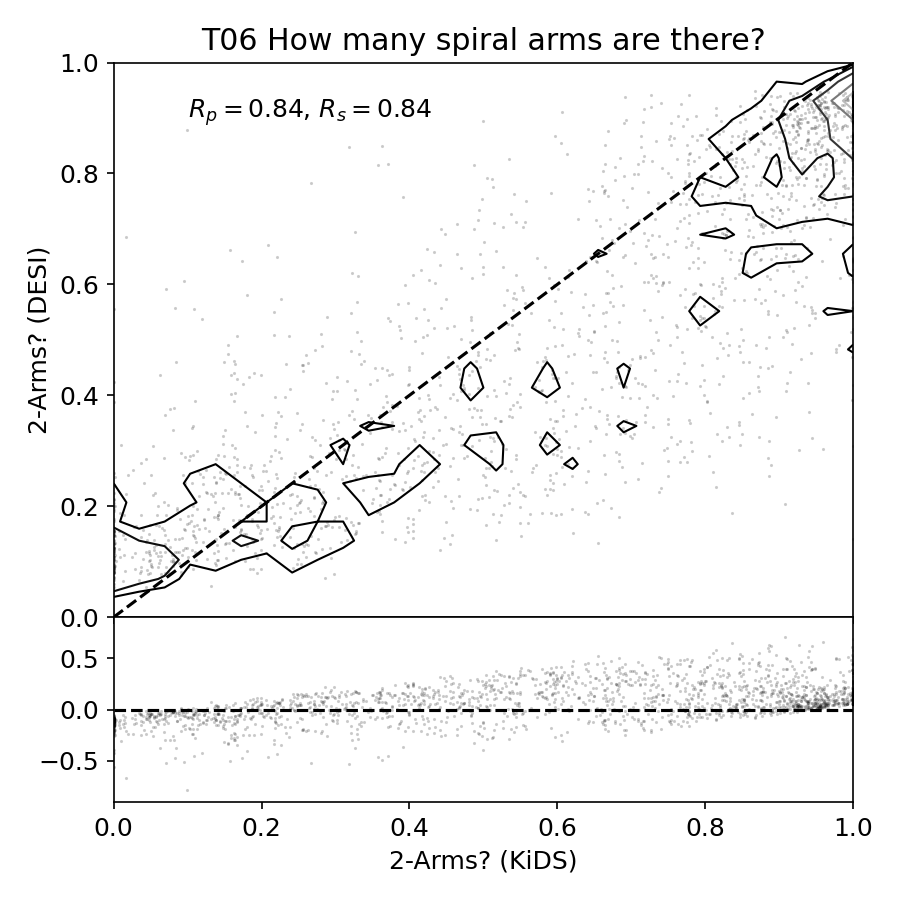
Or how many are there?
Sure there is some variance. That was to be expected. But as long as the volunteers (and ZooBot!) identify features, the follow-up questions agree well enough.
That brought me to the next question, can you use the voting predictions from ZooBot for the shallower DESI data to get a similar result. This was of interest to me since I have had a few undergraduate students work on the KiDS Galaxy Zoo catalog with some intresting results:
The Loneliest Galaxies in the Universe: A GAMA and GalaxyZoo Study on Void Galaxy Morphology
And that last one seemed like a good cross-check. Can we get Ren’s result but using the DESI Galaxy Zoo voting fractions?
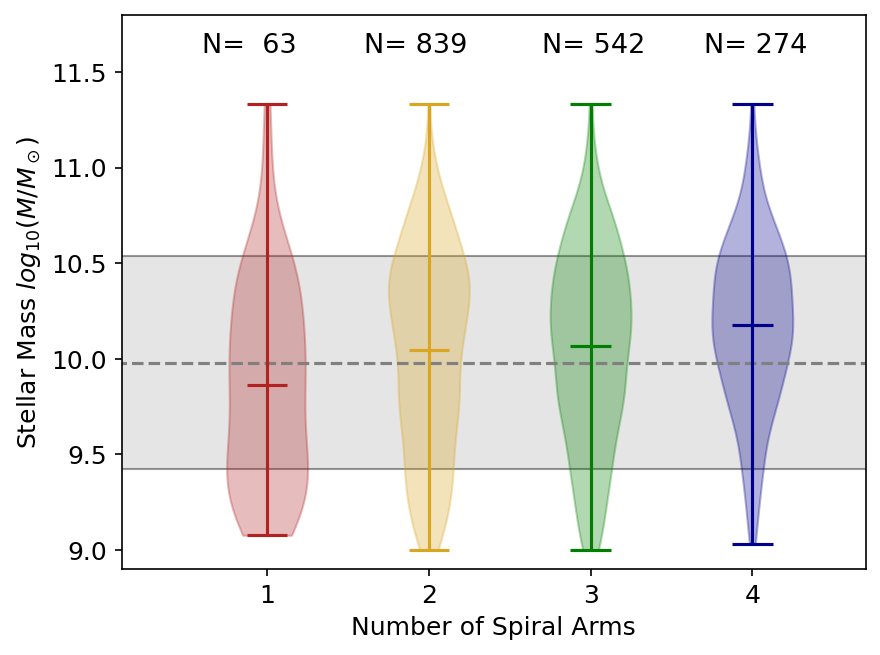
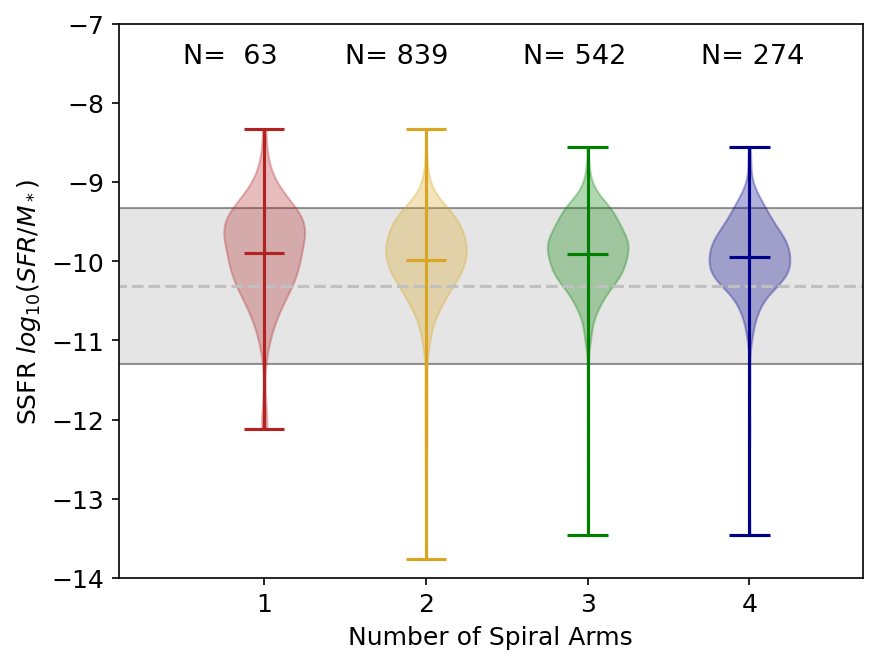
Doing the same but the number of spiral arms from the DESI ZooBot catalog from Holwerda+ 2024. The distributions of stellar mass for a given number of spiral arms in the KiDS Galaxy Zoo voting from Porter-Temple+ (2022).
And yes. The results are qualitatively the same. The statistics are a little worse because the DESI does not have as much voting on number of spiral arms as the deeper KiDS (because of the first question difference). But there is a pretty clear rise in stellar mass with the number of spiral arms. And the main conclusion, that the specific star-formation goes down is also recovered: the specific star-formation drops slightly with the number of arms.
The specific star-formation of galaxies with 1,2,3, and 4 spiral arms.
For the GAMA fields, this may not be relevant since the statistics in Porter-Temple (2022) were much better. BUT you can redo the experiment perhaps with DESI at scale.
Checking ML work remains critical in my opinion. You can’t just shrug and accept black box results. If there are opportunities to cross-check with a different data-set, I think that is perhaps unexciting but critical science.
I already talked about Rubin’s Galaxy, the largest disk galaxy in the Local Universe before. It remains a really fun galaxy to study in detail with other instruments. And that is what my collaborators on this (longstanding) project recently did:
A multiwavelength overview of the giant spiral UGC 2885
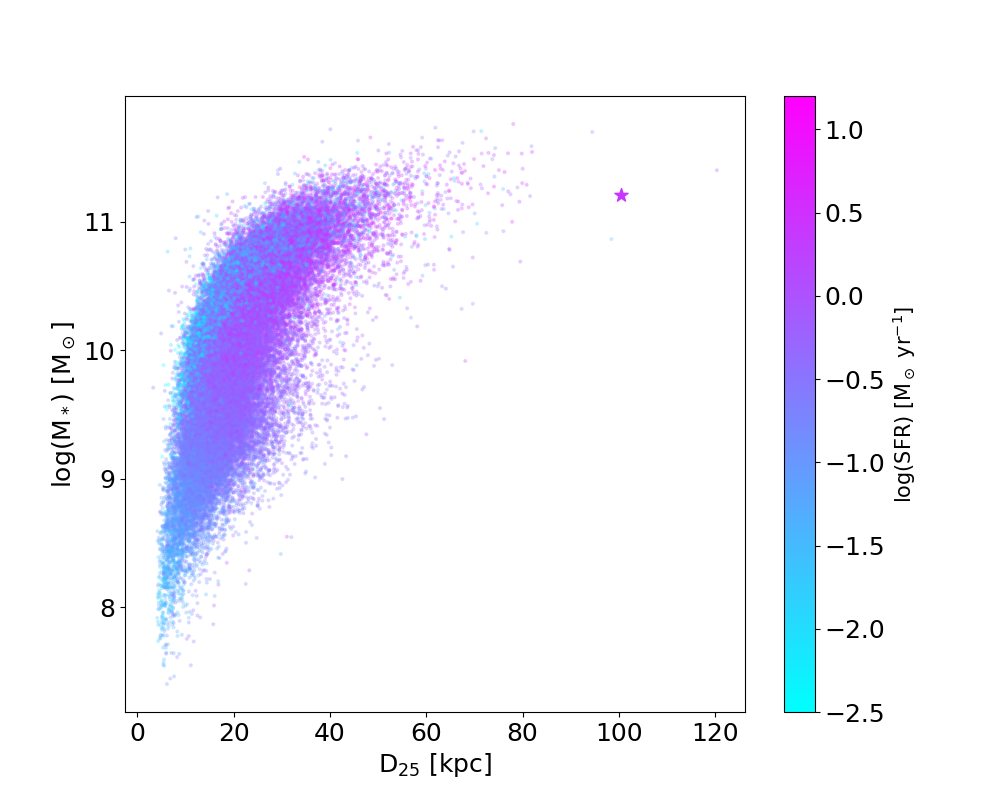
The first figure, just to establish that indeed Rubin’s Galaxy is a frikkin giant.
This was a good paper to collate all the stats on this galaxy in one spot. This will make it easier to refer to when we will study the gas supply and star-formation rate of this galaxy in the rest of the paper. The underlying idea is that it may point to how low surface brightness galaxies are perhaps a different mode of star-formation in galaxies.
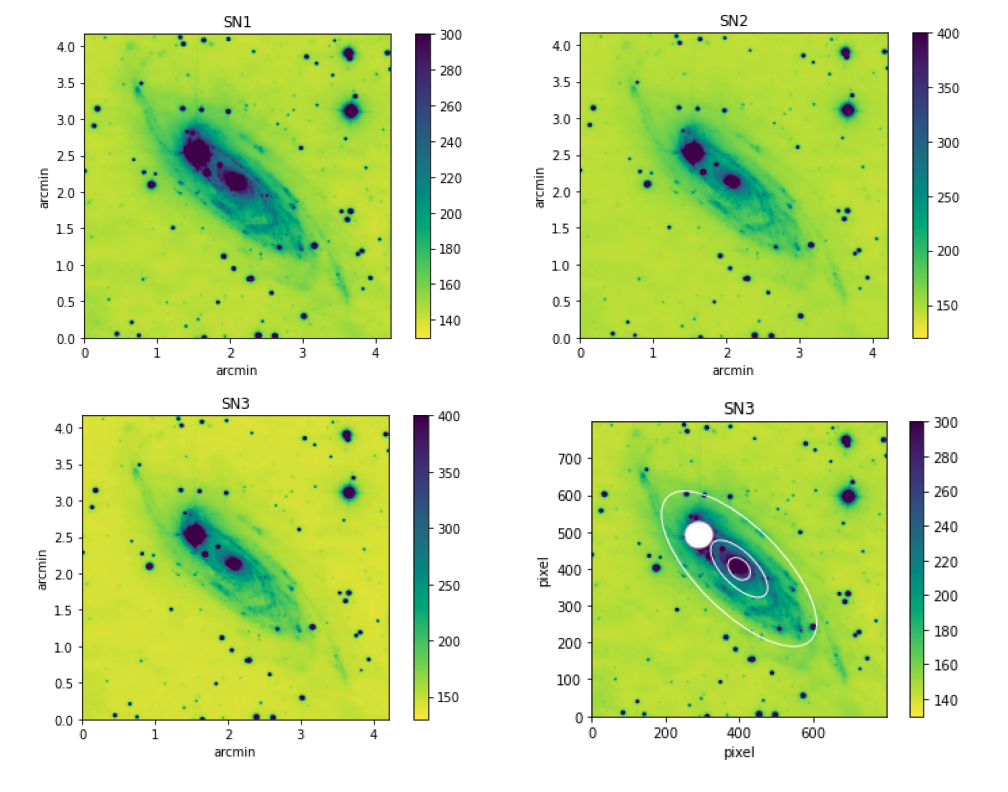
First new observations: SITELLE. This is a unique instrument in that it is an IFU but works interferometrically. Short bandwidth (wavelength range) but the longer you observe, the higher your spectral resolution becomes. Wild!
The SITELLE mapping of Rubin’s Galaxy in three narrow wavelength ranges.
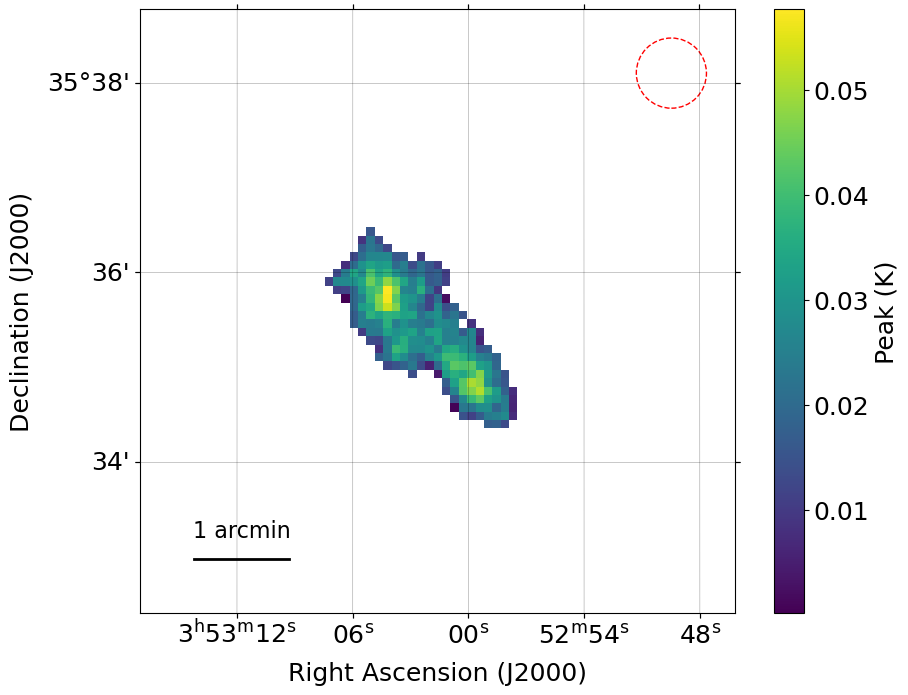
Second instrument is CO measurements using IRAM. This is to establish the molecular hydrogen reservoir. We already have HI observations of this galaxy.
The IRAM map of Rubin’s galaxy.
The IRAM observations also give a rotation map.
Blue and red map but not about elections. Galaxy rotation observed!HI and IRAM observations combined: all the gas fit to form stars.
The SITELLE observations gave us a — spatially resolved — map of the metallicity of Rubin’s Galaxy. It is mostly metal-poor.
So between the gas map and the current star-formation rate across the disk. The SFR was measured from the WISE fluxes.
So at the present consumption rate, how long will it be before Rubin’s Galaxy runs out of fuel?
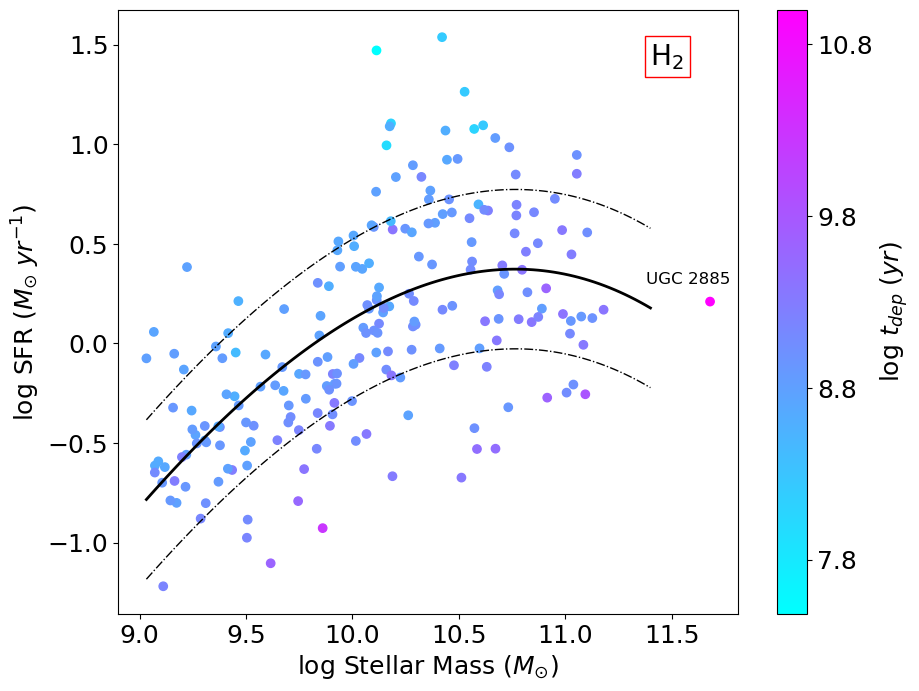
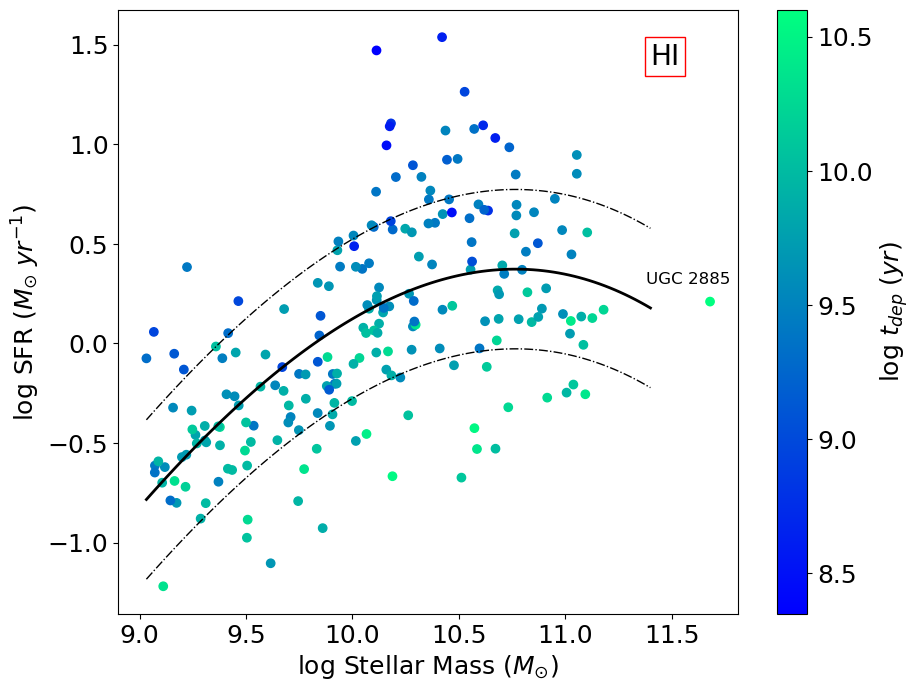
The stellar mass and star-formation rate of galaxies and Rubin’s Galaxy, color-coded by depletion time of the H2 (molecular gas) supply inferred from IRAM observations. Over 10 billion years!The stellar mass and star-formation rate of galaxies and Rubin’s Galaxy, color-coded by depletion time of the H2 (molecular gas) supply inferred from HI observations. Over 10 billion years!
Rubin’s galaxy has over 10 Billion years of fuel left in the tank! Well over a Hubble time, the current age of the Universe!!
This paper is a short letter pointing to the spectroscopic confirmation of a dusty dwarf at z=5. There are a few things remarkable about this object. It’s a metal- and dust-rich dwarf galaxy. Those are supposed to be metal poor and pretty much transparent. And that this galaxy is doing this at z=5!
The evidence for both dust extinction and the metal content comes from spectroscopy with James Webb Space Telescope for the Cosmic Evolution Early Release Science Survey (CEERS). JWST will make spectroscopists of us all yet.
The spectrum of CEERS-14821. These optical emission lines, emitted in the infrared at z=5, redshifted to 2–5 micron by the time they were observed with JWST NIRSpec instrument.
Dust
The dust in this low-mass galaxy does two things. First it does not show in Hubble images. There could be a whole population of these at higher redshift that we are missing up till now!
Secondly, it reddens the emission that we now see with JWST. This was the optical emission (rest-frame optical means it was an optical photon when it left, the travel from z=5 to now means it’s been redshifted to infrared when we detect it. Travel is hard on these poor photons).
We measure this reddening with the ratio of two emission lines from the Hydrogen atom: H-alpha and H-beta. If this is a “normal” 40.000K plasma around newly formed stars, these lines are shining in an expected ratio.
However, the longer wavelength one will be dimmed preferentially by interstellar dust. The observed ratio between H-alpha and H-beta thus tells us how much dust reddening happens(very similar to a sunset next to a refinery).
The full CEERS catalog with stellar mass and dust extinction AV. AV above 1 is optically thick; it is near impossible to see through this galaxy, with much of the starlight absorbed. This dwarf, CEERS-14821 may be a prime example of perhaps a population of such galaxies.
The two stars (green and red) are the amount of reddening in this small dwarf galaxy (I mean that is 100 million solar masses, its small). It shows that this galaxy is optically thick. There is no looking through this thing.
Metals
And secondly, the ratio of emission lines of Hydrogen and Oxygen tells us what the level of heavier elements is(astronomers call everything heavier than Helium a “metal”. Most of it is Oxygen anyway. Drives Chemist nuts).
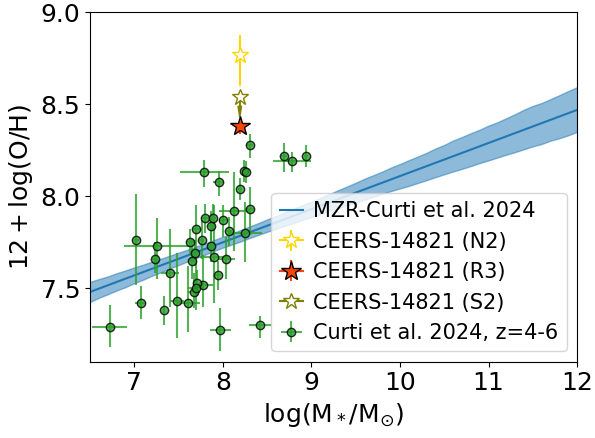
The stellar mass and metallicity plot for a sample of z>4 galaxies and the new dwarf. Metal-rich dwarfs may be quite common at this redshift.
And as we can see our dwarf CEERS-14821 is high on the y-axis, which is the ratio of Oxygen over hydrogen. Lots of dust and lots of metals.
And now on why that is weird: small galaxies lose their interstellar matter quite easily. One supernova and poof, it’s blown out. A bigger galaxy is near, they lose it to that. Meanwhile this one has kept a lot of it.
If this was a unique case, that would be one thing. But at z=5, it is entirely possible that these dusty, metal-rich dwarfs are a common sight. It could well be that a lot of star-formation at that redshift is happening in these dusty dwarfs, hiding much of this from our observations up till now. How that first build-up of galaxies and stars works is still quite a mystery.
Galaxy morphology changes once you go to a different color. You are more sensitive to different stellar populations. Blue filters pick up young, massive stars for preference and redder filters the older population of galaxies, one is more sensitive to star-formation, and the other overall stellar mass (something the S4G survey used to great effect).
This brings me to the narrow-band magic. Narrow filters are only sensitive to a short wavelength range. But if an emission line happens to lie in that range, the contrast for those images will be fantastic.
This is the idea behind the Merian Survey and what this week’s paper is all about:
A Nonparametric Morphological Analysis of Hα Emission in Bright Dwarfs Using the Merian Survey
The two filters used, each capturing either Halpha or Hbeta+OII. So instead of a morphology estimate that is dominated by stellar populations, the morphology of your images is almost exclusive the emission line. These emission lines, especially Halpha, is powered by new star-formation. So this survey maps new star-formation in nearby galaxies and where it occurs. They combine their observations with a local estimate of the stellar continuum from z-band.
The optical image, narrow-band image, the continuum contribution and the line emission image of galaxies of this survey. This is a neat way to map lots of galaxies fast!
This allows for a clean segmentation of the image. The issue with Halpha imaging is often that it is very fractured. Individual HII regions are not inter-connected. So it is hard to define the part of the image over which to compute…drumroll please…morphometrics!
some of the segmantations of the images. Continuum defines the area, and then the morphometrics can be calculated over the Halpha flux.
One can then start exploring the HII morphology space and its dependence on inferred galaxy properties; stellar mass and overall star-formation rate or combine these into specific star-formation rate (SSFR).
The Gini-M20 plane with Asymmetry color-coded to show where Halpha and sdss-r contunuum light morphology lie for the sample. Note that the continuum lies in the disk galaxy space, but Halpha shows a much greater range.
This is the Gini-M20 space that Lotz+ has used to identify disks, spheroids and interacting galaxies. The divisions look to be very different in Halpha morphology though!
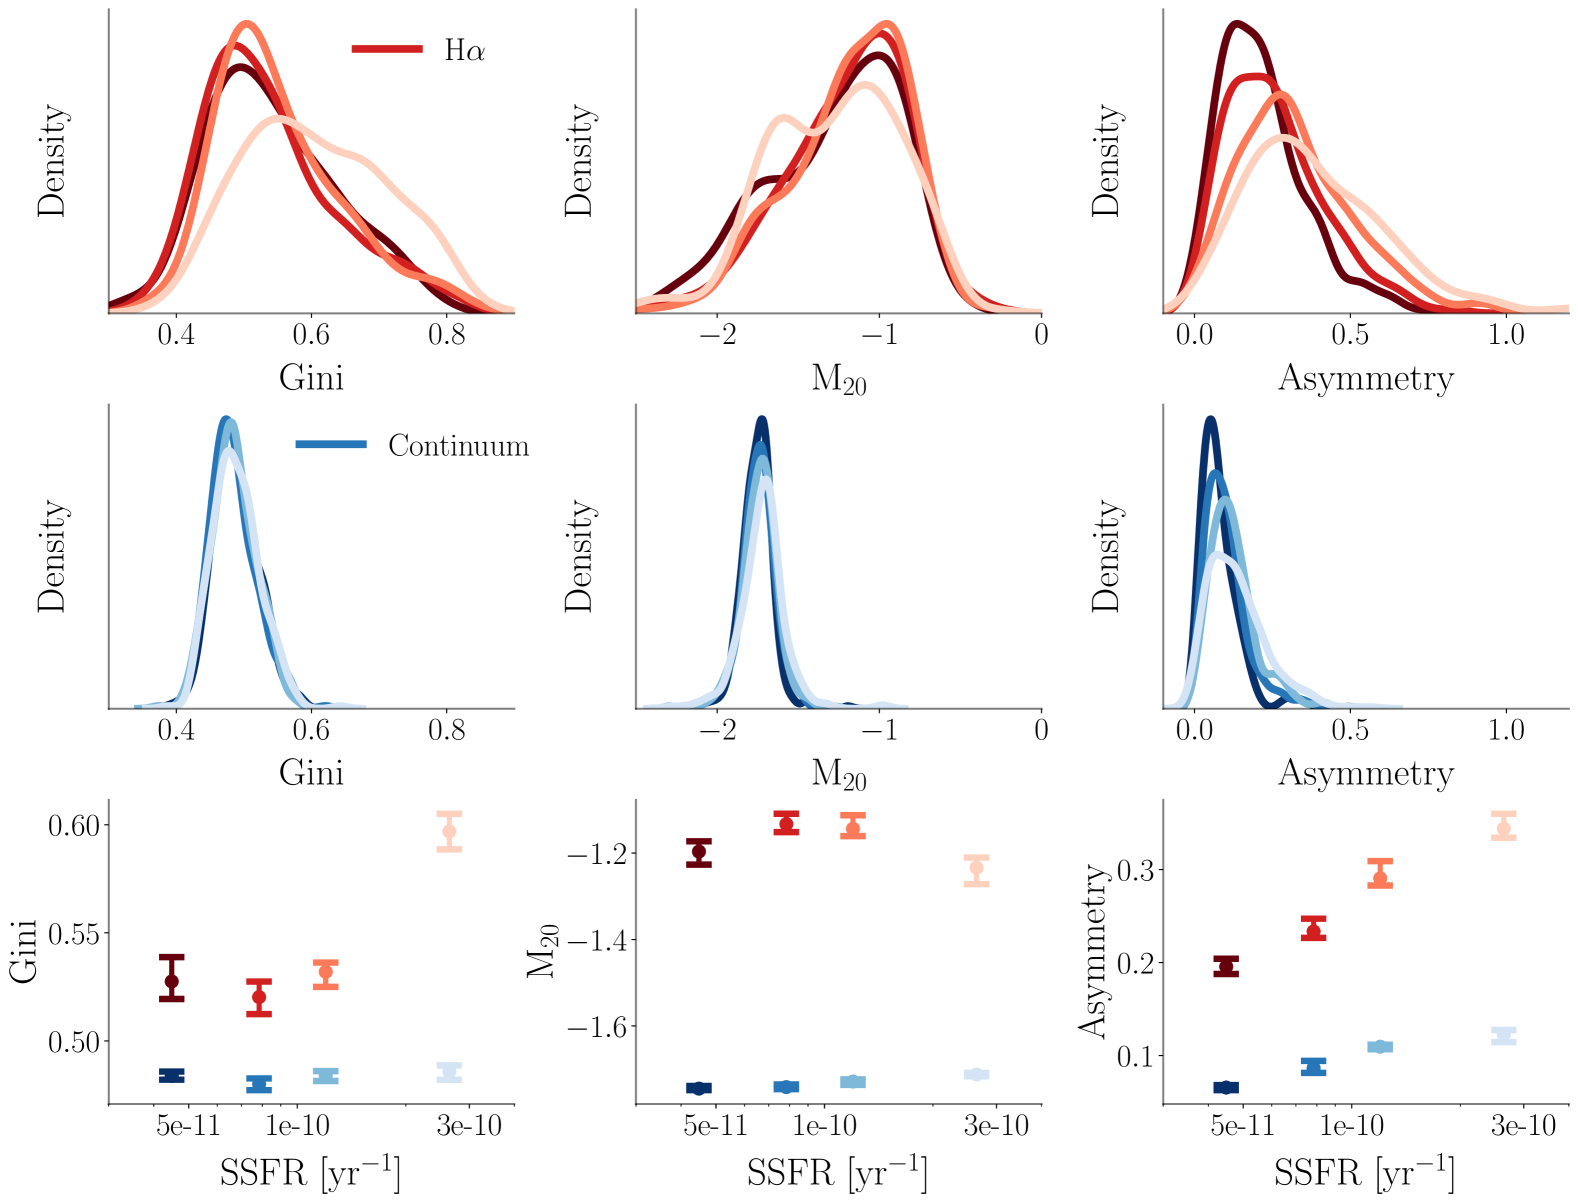
The distributions of morphometrics as a function of stellar mass. These seem to not change much with mass.The morphology in Halpha does seem to change a lot with specific star-formation. No surprise since Halpha is driven by star-formation. If there relatively a lot of it, the morphology changes. Even if the underlying disk is not very perturbed.
The potential weakness is that the view of Halpha is skewed by dust. The authors address this and correct for this some. But to correct the morphology completely for that, commensurate hot dust (e.g. 20 micron imaging) would be necessary. Peter Kamphuis used something like that on…you guessed it NGC 891.
The correlations with SSFR is a first good exploration. I am curious to see what the survey team is going to be working on next!
Spiral galaxies come in all sizes. One of the more impressive things about them is that over 6 orders of magnitude they are self-similar. Meaning that unless you had an inkling of the distance, all disk galaxies are exponential declining light profiles, rotate with similar (enough) rotation curves and basically look the same.
But up to a point right? There is such a thing as too big a disk galaxy. Extremes can be very informative in an observational science so what are the biggest disk galaxies at a particular time in galaxy evolution?
Locally the biggest disk galaxy title is held by “Rubin’s Galaxy” (UGC 2885), named after Vera Rubin. This is one I studied together with my collaborators extensively (some of the papers were going to come out in 2020…). The amazing thing about this galaxy is that despite that it is 10x the mass and 5x the size of the Milky Way, it neatly lies on all the scaling relations for disk galaxies! It’s an Sc galaxy…just…really big.
The Hubble mosaic of Rubin’s Galaxy, UGC 2885. Rubin originally pointed out in her other 1980 paper that this was an unusually large disk galaxy. It shares the title of biggest disk galaxy with Malin 1, an low surface brightness disk. How such a disk galaxy grows over time and importantly, stays a disk is a key point my collaborators and I hope to learn more about.
And there is a class of big spiral galaxies called “super-spirals” of about the same size and mass (log(M*) ~11.5). Those are often quite perturbed looking and are assumed to be the result of a merger where the disk miraculously survived.
This brings me to the paper this week:
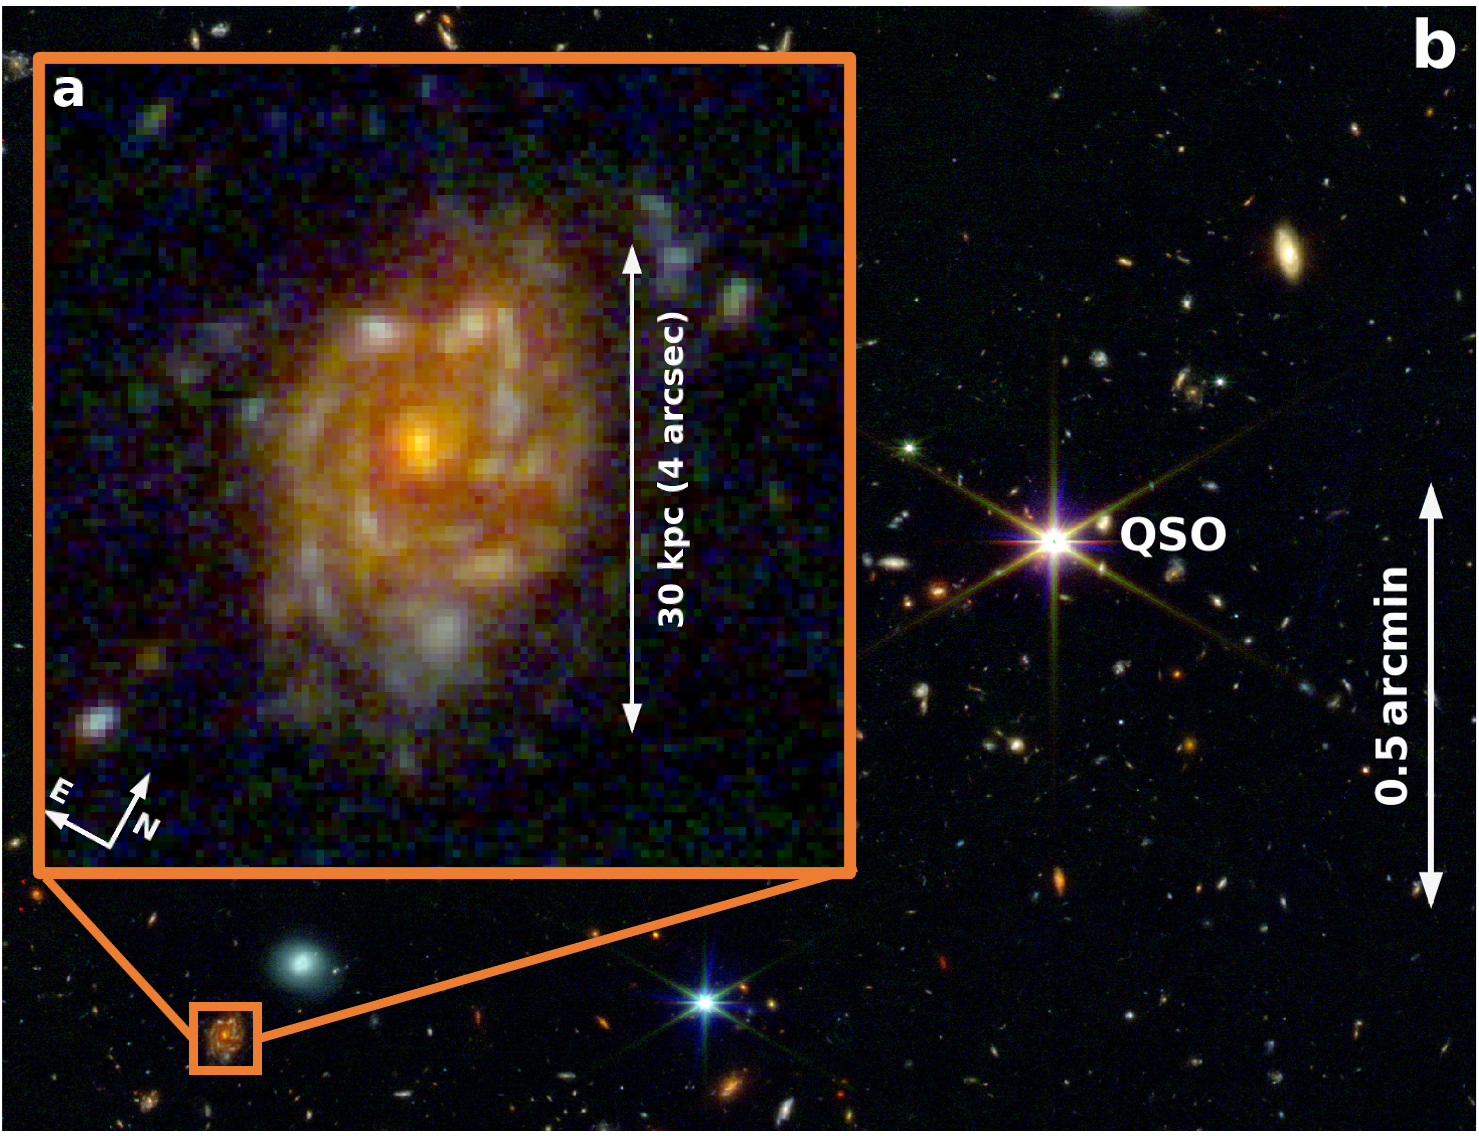
A Giant Disk Galaxy Two Billion Years After The Big Bang
A big disk like that at high redshift is a prime target to see if disks rotate still the same in this much earlier epoch. So the authors targeted this disk with three slit observations for rotation. And indeed there it is; rotating pretty much like a local galaxy.
Kinematic long-slit observations. These may or may not capture the turnover point for a rotation curve. Pretty convincing curve though.
With distances, morphology, and now kinematics from HII regions (just as V. Rubin found her rotation curves in the 1970’s), this galaxy can directly be compared to the scaling relations in the local Universe.
Scaling relations for z=3 galaxies and Big Wheel. The galaxies is more extended (top panesl) than one expects from trends. The star-formation rate is where one would expect it to be at z=3. The kinematics however resemble more a settled z=0 disk, a super-spiral, than z=3 disk galaxies observed so far.
And while it lies in the same mass-range as Rubin’s Galaxy or the super-spirals from Ogle+ 2015,2019 and Di Teodoro, it looks like a normal disk galaxy in most measures for a z=3 galaxy (star-formation rate) but it is much more extended for its mass than z=3 galaxies.
I wonder how Big Wheel (Tori Amos fan, the authors?) will evolve. Will it become an LSB giant? Something like Rubin’s Galaxy? Or will a disk not survive the 10 Billion years of further evolution?
To become Rubin’s galaxy, star-formation would have to crash, a drop of about 2 orders of magnitude. Other than that, it has a similar rotation velocity and stellar mass! And frankly, a very similar morphology (4 arms, Sc galaxy. Even our view of it (inclined) is similar.
How much stellar mass is there in a galaxy? We see a certain amount of light from galaxies and that implies a certain number of stars. It depends on the mix of stars and the redder, the easier the conversion is (less dust, or over-weighting blue, short-lived stars).
And honestly, the problem of weighting the stellar mass of galaxies had shifted into the “solved problem” category. Not perhaps something to get complacent about but no longer estimates what were orders of magnitude off. I quite clearly recall a talk where the uncertainty was set at 0.2dex (less than a factor 2) for any survey.
But that was for big galaxies, that have been around a long time. Think Milky Way and bigger. We studied those the most, we understand those the best. We are entering the era of the Dwarf (insert obligatory Tolkien or Rings or Power reference here). We will observe many more dwarf galaxies in the near future and understanding dwarf galaxies is critical in our understanding how galaxies form, reionize the Universe, and coalesce into bigger galaxies.
And stellar mass estimates for dwarf galaxies…well…
This was a problem that was neatly show at the NASA Galaxies Science Interest Seminar by Professor Mia de los Reyes: YouTube.
Which brings me to this week’s paper and one I was looking forward to:
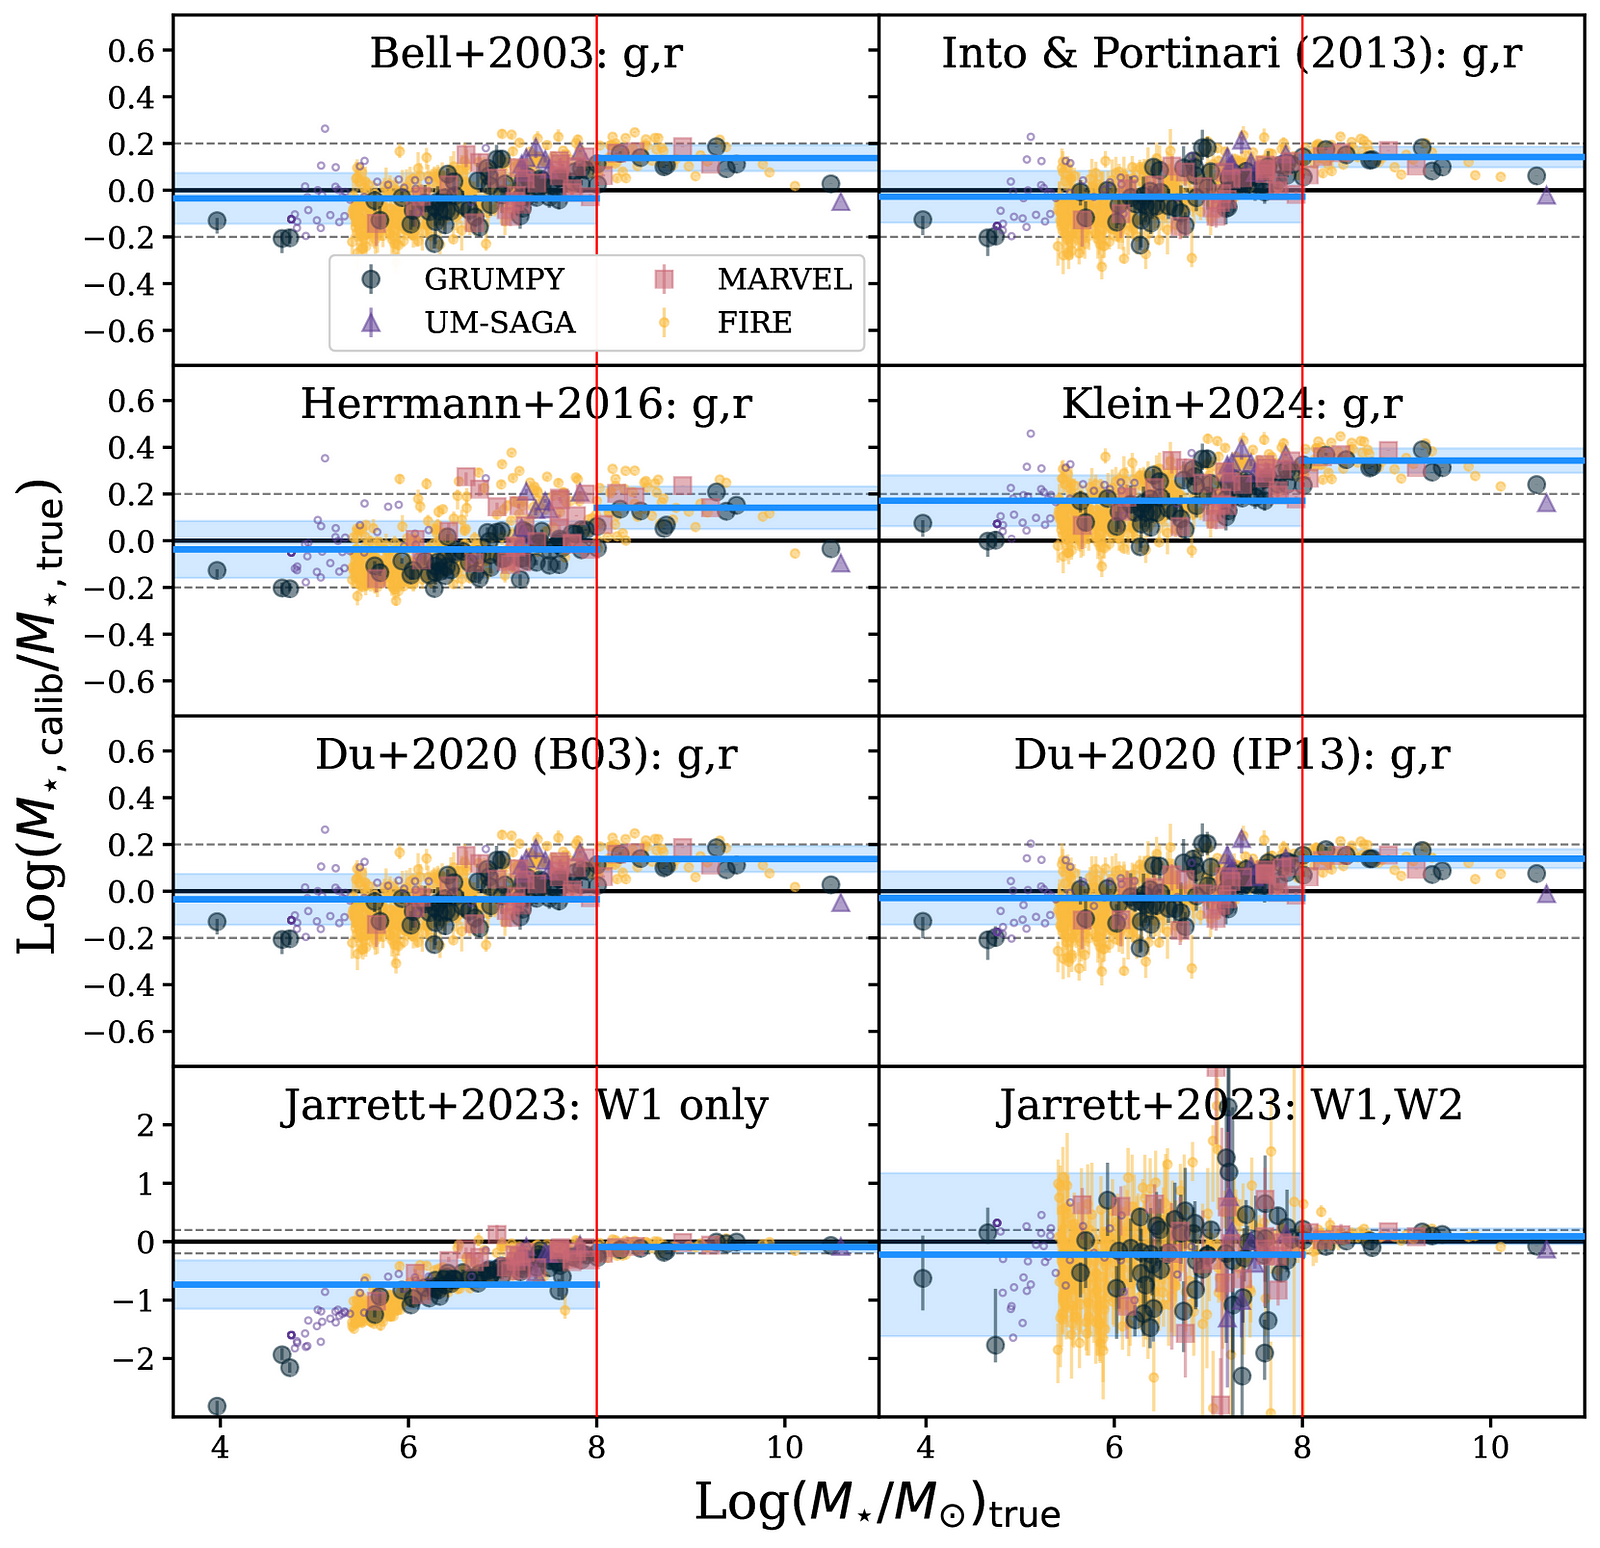
Stellar Mass Calibrations for Local Low-Mass Galaxies
Which addresses how well each stellar mass conversion works for dwarf galaxies that we have made in simulations. This has a few benefits: first you know the ground truth (the galaxy is in your computer) and secondly, it allows you to sidestep any issues with photometry between different surveys. Gotta keep track of all the systematics and here is one specific one you want to tackle.
The traditional photometry to stellar mass estimators. I can think of at least one more but this neatly shows how a luminosity and a single color is converted into a stellar mass. Works okay for massive galaxies, starts to introduce significant biases and error in the lower mass regime.
The first is straight-up conversion from one filter and a color into a mass. As you can see, in the dwarf regime, the deviation from true is dramatic, often quite dire. This will work okay for your survey of big galaxies or even Milky Cloud Galaxies (Dr de los Reyes is a proponent of calling these not after Magellan anymore, see here).
Correcting the bias can be worked out but a noisy relation remains. Perhaps that is sufficient for your purposes. It may not be.
But knowing this, one could, conceivable, calibrate this conversion (this mass-to-light ratio) and make it mass-dependent. As the plots above show, it can be fixed. Some.
But we rely on full Spectral Energy Distribution modeling these days to get stellar mass, dust mass, star-formation rates and increasingly, star-formation history and metallicities as well. How do these do in the Dwarf regime? Below are a few different star-formation histories. Each a different function of the age of the galaxies and how many stars it produced at that time.
Parameterized star-formation histories going into SED fits. These are simple functions like a constant, an exponential decline or an exponential decline with a single spike. These are very significant assumptions to make of the shape of a SFH (e.g. it must be declining) for the sum of the history is the mass we are after.A more flexible approach is the non-parametric (a misnomer I feel, there are parameters, just more of them?) to allow for all kinds of shapes for the SFH. Hopefully constraining better the kind of total integrated mass from these histories.
There are even less parameterized functions to account for the star-formation history. There are some in the above plot.
The point is that there is still an offset. Not massive in terms of big galaxies, but critical if you want to understand smaller galaxies. It those are suddenly all under-estimated, your whole study can be critically biased.
I think a systematic approach such as this one, is present-day extra-galactic science at its best. A methodical study of the inherent noise and bias in our estimates. I have always been a bit nervous about the fact that so many of our SED codes are effectively calibrated on NGC 891 and maybe the Sombrero and Arp 220. This is getting better but one worries about the effect of the survivor bias in what was studied in detail.
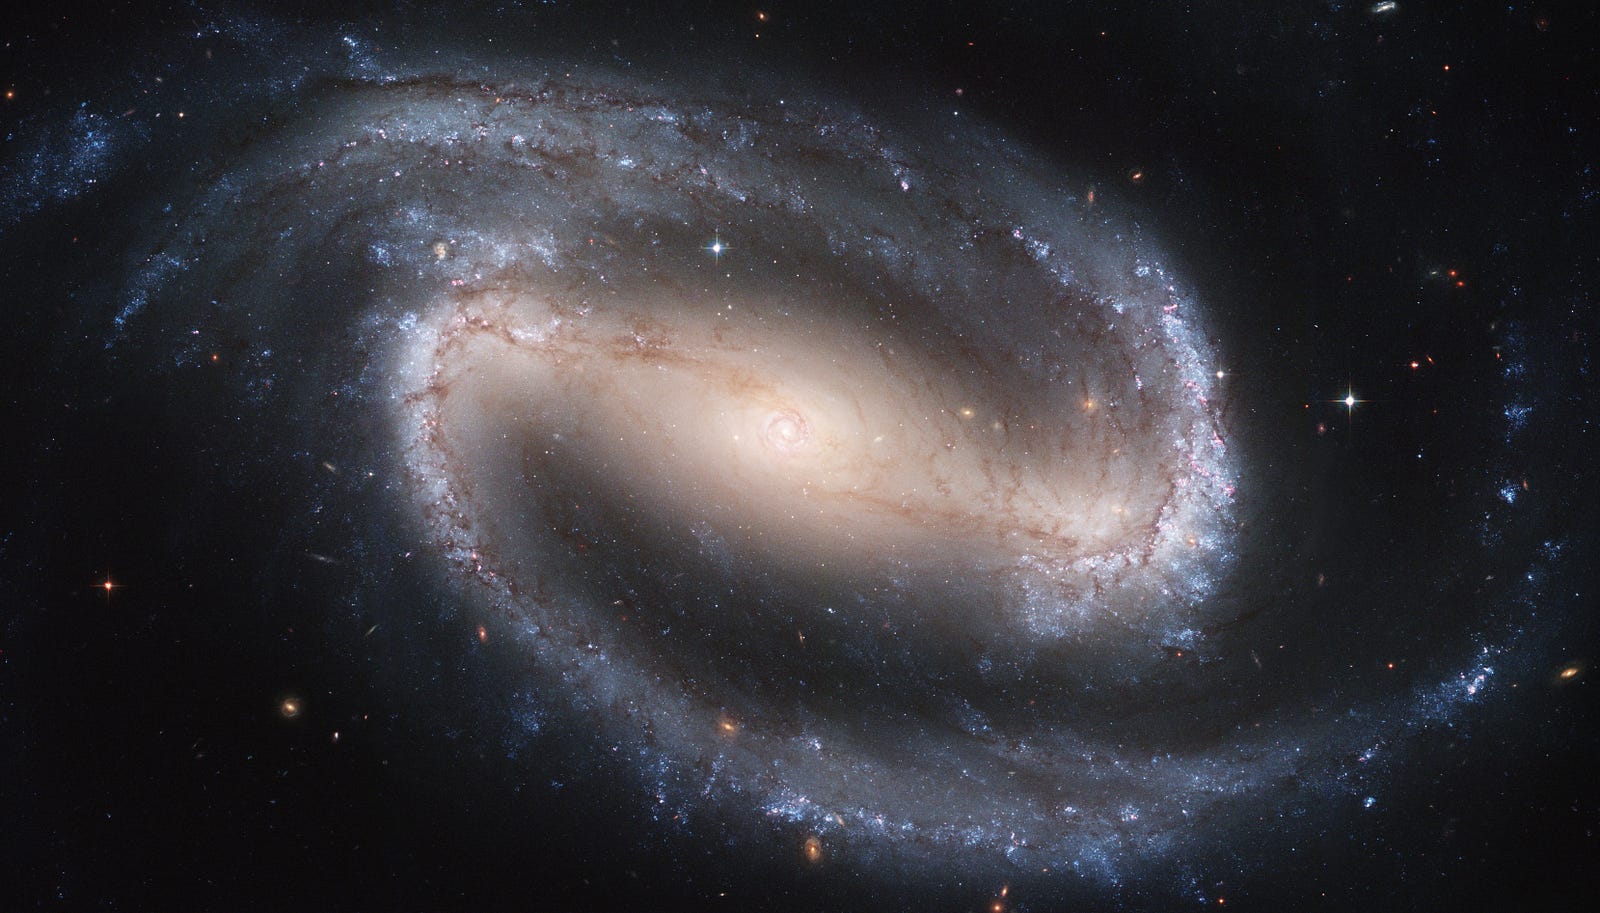
Disk galaxies often have a “bar” at their center. A rectangular shaped, often yellow-ish structure. We understand this is a bunch of the older stars in the disk moved from circular orbits to highly elliptical ones.
NGC1300 the original barred galaxy. There are many like it.
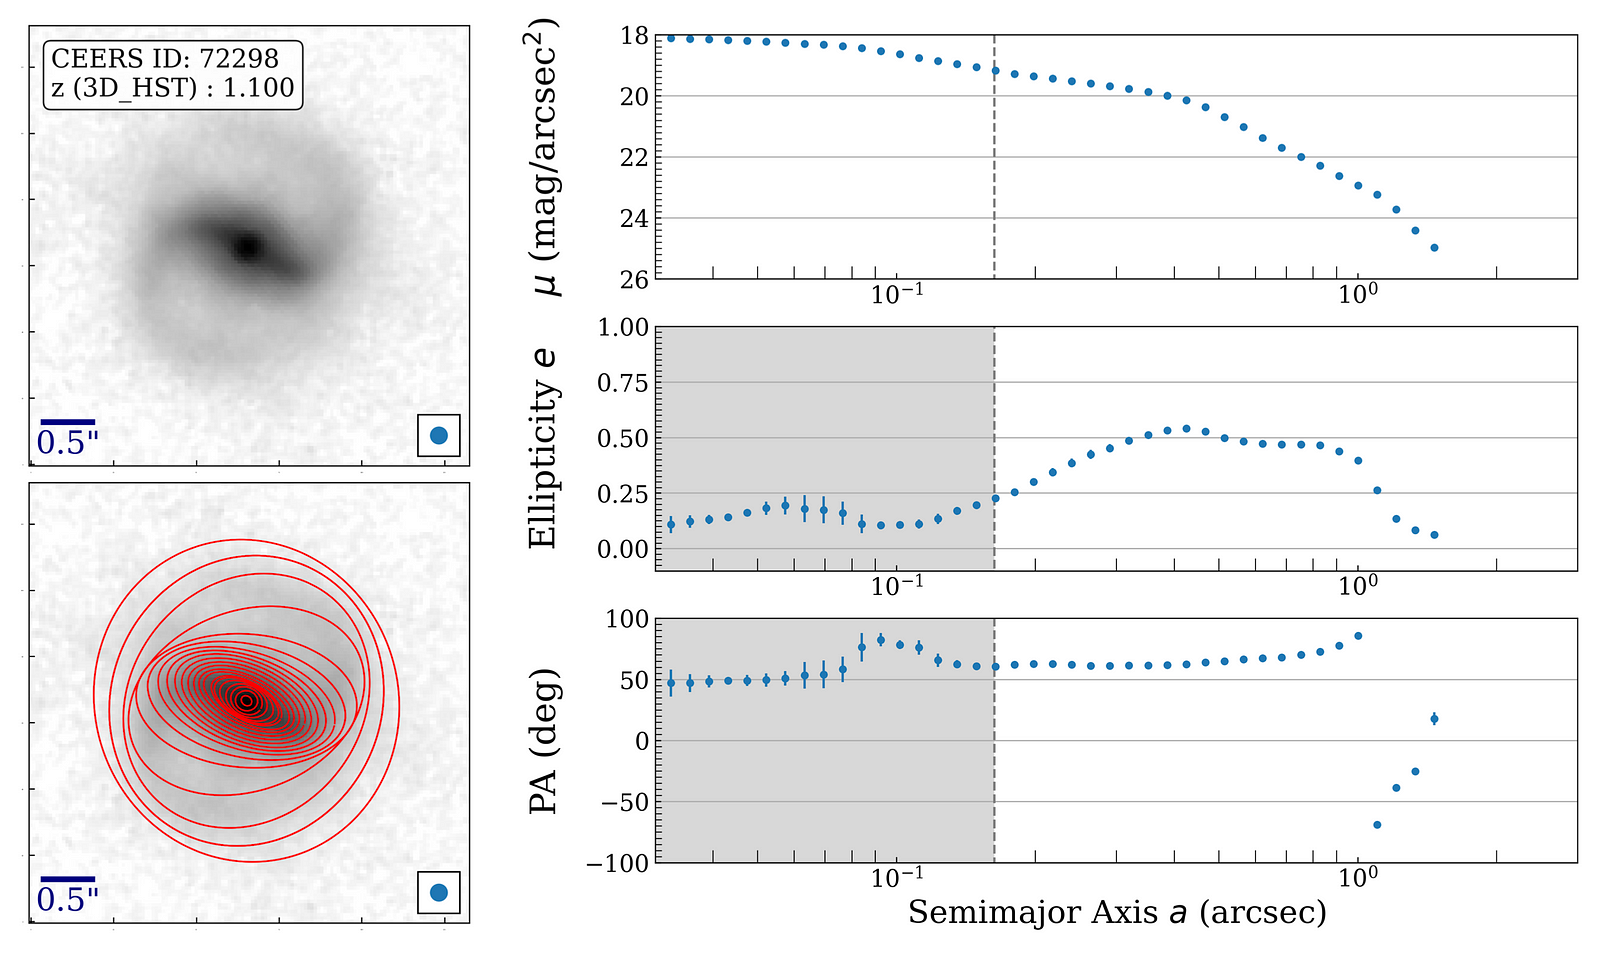
Now this leaves us with a few questions: how often does this happen? That is something the GalaxyZoo project can help you with. That would give you visual classifications and those can be quite good. The other way to find out is to fit isophotes (lines of equal amount of light) to the galaxy. The Bar stands out as highly elliptical isophotes and the position angle of those ellipses radically changes at the edge of the bar. It leaves a clear signal. Like in the galaxy below.
The isophotal method of bar detection. The ellipticity drops when outside the bar and the position angle goes all over the place (see at 10⁰)
This brings me to this week’s paper:
The Abundance and Properties of Barred Galaxies out to z∼ 4 Using JWSTCEERS Data
Where the CEERS team looked at galaxies far away, as seen with the JWST. The benefit here is that we can do this exact analaysis to much greater distances and thus lookback times. This brings me to the other question: how long have galaxies had bars? That can be trickier to answer and there was quite a bit of disagreement with the early Hubble studies. I was impressed with these, cleverly using the above type of analysis on Hubble fields and calibrating the counts with local galaxy images to see how many bars had been missed. But Hubble has its limitations and beyond redshift z~1 would be too challenging for Hubble’s cameras and their wavelength range.
To recap, one can find bars visually or with the isophotal technique. There have been many studies using Hubble and now a few with JWST to expand the range to much higher redshifts. The observational situation is as follows:
The fraction of bars of a population of galaxies observed with Hubble (small symbols, many different authors) and the few JWST studies and the two done by Gao+ in this paper. The visual and isophotal techniques agree pretty well and if JWST is to be believed, bars were already present in substantial numbers at z~1. This definitely pushed the appearance of bars up.
Bars in the present day is ~40% of all disk galaxies. But as we look back over the last 10 Gyr, the fraction drops to 10% or so. What is amazing is that there seem to be bars already at z=3.5. Some have been reported even further! That would make bars something that could form much earlier and perhaps stick around for a much longer time than we thought?
We are still not done though. Are these bars the same bars we see locally? Do they spin around the disk at similar speeds? Do bars from slowly at first and then a lot in the past 5 Gyr? Are bars just a phase or a longer, sustainable pattern in a disk? What is remarkable is what we can also see: a galaxy 1 Gyr after the Big Bang can have a bar in a disk. That pattern establishes itself early.
In a previous blog post I gushed about the wonderful new JWST data on NGC 891, an edge-on galaxy with an ultraviolet halo. This week I’ll talk about this paper:
Illuminating the Incidence of Extraplanar Dust Using Ultraviolet Reflection Nebulae with GALEX
The authors use archival GALEX data to look for ultraviolet light from well above and below the plane. One of the authors has already done so with H-alpha, the emission line of ionized hydrogen. The idea is to look of blue light tracing star-formation can be seen well away from the disk of the galaxy seen edge-on.
A figure from Seon+ 2014 on NGC 891 (yes that one) showing the UV coming from more than just the thin disk.
This is important because we think there is no star-formation there. So if we see the blue or ultraviolet light there, it must have reflected off something: high latitude dust clouds. Also called cirrus or galactic cirrus. And apart from a lot of paper on NgC 891 (including a few I’m involved in) there isn’t a lot of evidence of galactic cirrus in other galaxies.
This is why this is a nice and clever paper. They collected all the edge-on galaxies for which there was GALEX data, examined them all individually and found 7% have this extra-planar UV halo. Earlier authors [] also found similar incidence rates. But GALEX is not very high resolution data so it’s hard to tell. In this paper, they also stacked all the data to look for a UV halo. The authors conclude the scatter off cirrus is much more common than 7% and there is UV light coming from well above and below disks.
They relate this to mass and star-formation rate of the galaxies here:
Figure 15 from the paper showing the vertical profile stacks for different star-formation rates.
This figure above shows the absolute star-formation rate, I would have asked for a relative (specific) star-formation rate as well. Do smaller galaxies with relatively more star-formation produce more cirrus?
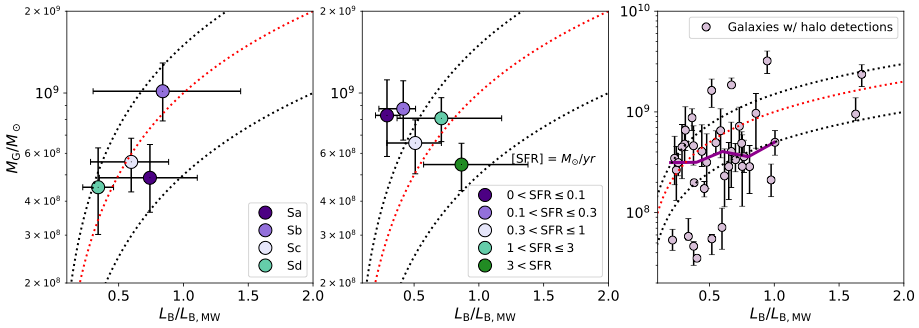
The authors link the mass, star-formation and the amount of gas extra-planar in this cirrus.
The normalized luminosity with respect to the Milky Way on the x-axis and the amount of extra-planar gas implied on the y-axis. On the left and middle are the stacked results — either by type or star-formation rate — and on the right are the directly detected cirrus UV reflections. The lines are assuming 5,10 or 15% of all the disk gas is in the halo. There is quite a bit of variety with disk luminosity!
Unfortunately, this will be it until we get more ultraviolet imaging. Maybe with SWIFT (not the singer) or a new NASA mission UVEX. The latter is set to observe the whole sky, deeper and in high resolution. That will give us the kind of data one can use to study the galactic cirrus in much more detail.
Ok so why do we care again about galactic cirrus? because this hints at a self-sustaining refueling mechanism in disk galaxies. The cirrus material is blown out, the metals and dust in that material helps cool hot halo gas and it all rains back down on the disk of the galaxy, triggering new star-formation!
And it is apparently pretty common. Maybe this is how disk galaxies get (much? Most) of their refueling!