Galaxy morphology changes once you go to a different color. You are more sensitive to different stellar populations. Blue filters pick up young, massive stars for preference and redder filters the older population of galaxies, one is more sensitive to star-formation, and the other overall stellar mass (something the S4G survey used to great effect).
This brings me to the narrow-band magic. Narrow filters are only sensitive to a short wavelength range. But if an emission line happens to lie in that range, the contrast for those images will be fantastic.
This is the idea behind the Merian Survey and what this week’s paper is all about:
A Nonparametric Morphological Analysis of Hα Emission in Bright Dwarfs Using the Merian Survey
Mintz+
[astroph]

The two filters used, each capturing either Halpha or Hbeta+OII. So instead of a morphology estimate that is dominated by stellar populations, the morphology of your images is almost exclusive the emission line. These emission lines, especially Halpha, is powered by new star-formation. So this survey maps new star-formation in nearby galaxies and where it occurs. They combine their observations with a local estimate of the stellar continuum from z-band.

This allows for a clean segmentation of the image. The issue with Halpha imaging is often that it is very fractured. Individual HII regions are not inter-connected. So it is hard to define the part of the image over which to compute…drumroll please…morphometrics!

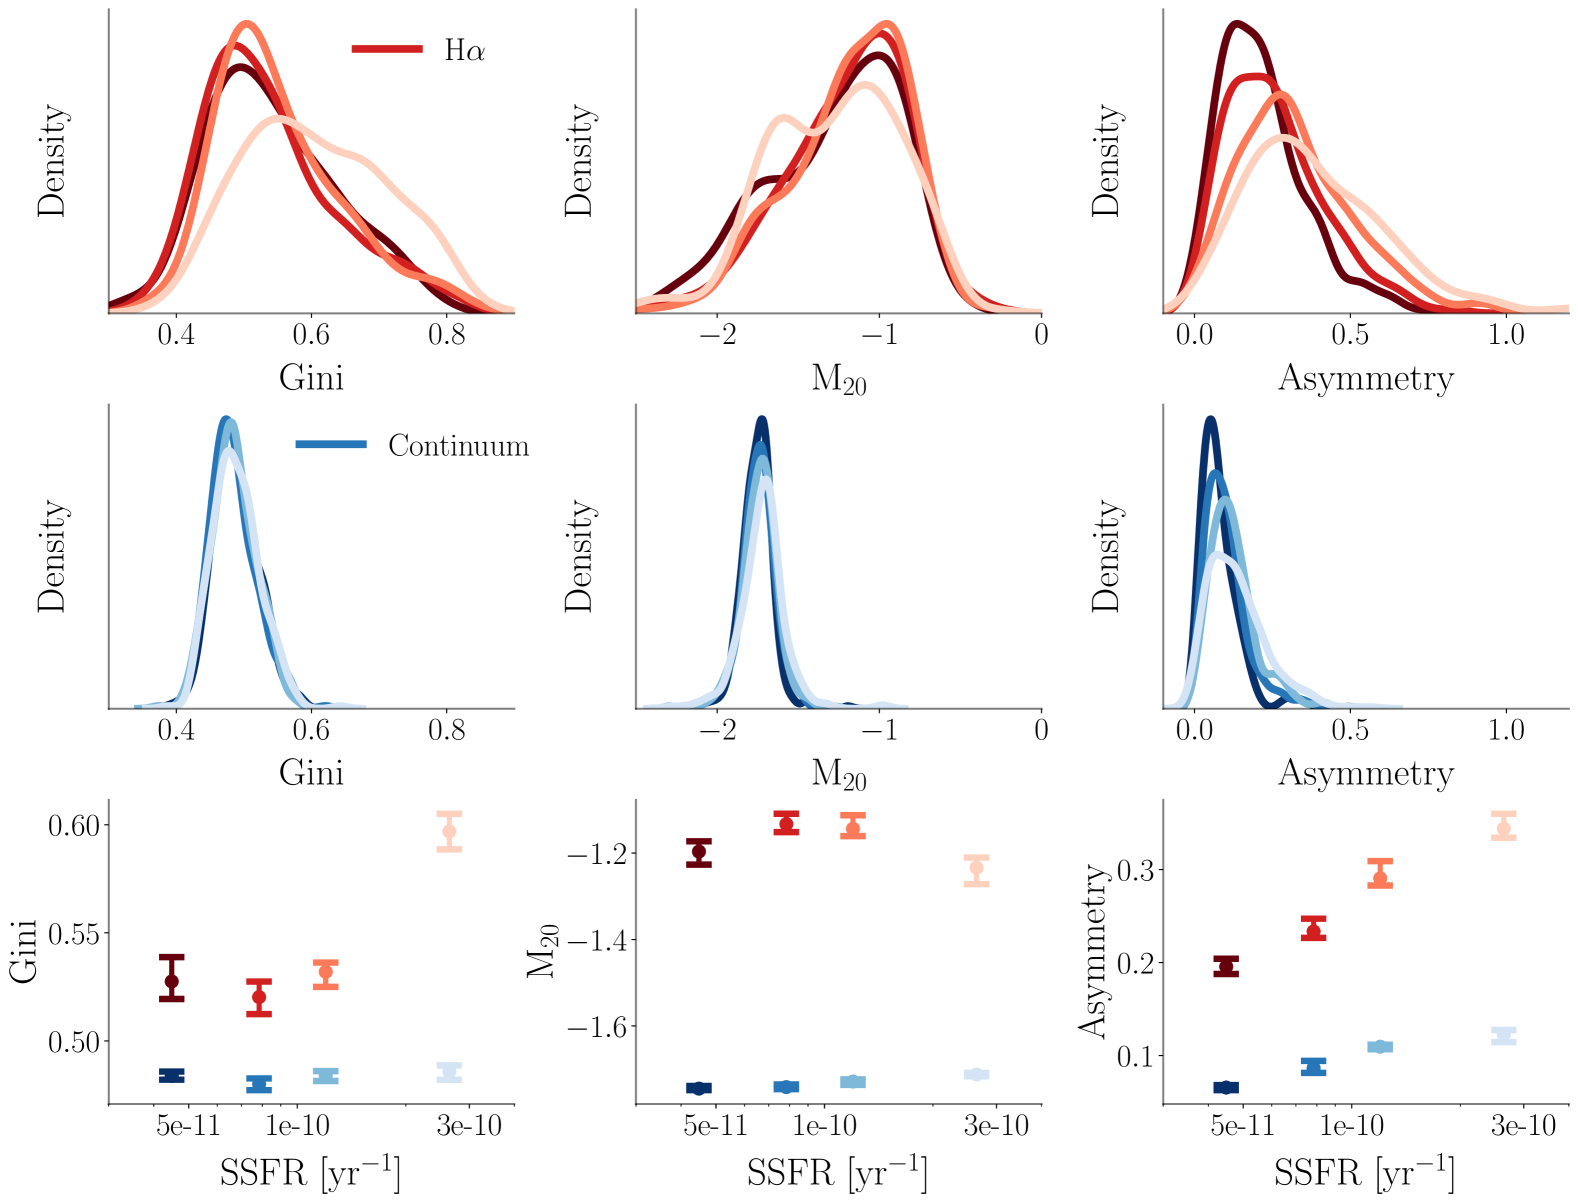
One can then start exploring the HII morphology space and its dependence on inferred galaxy properties; stellar mass and overall star-formation rate or combine these into specific star-formation rate (SSFR).

This is the Gini-M20 space that Lotz+ has used to identify disks, spheroids and interacting galaxies. The divisions look to be very different in Halpha morphology though!


The potential weakness is that the view of Halpha is skewed by dust. The authors address this and correct for this some. But to correct the morphology completely for that, commensurate hot dust (e.g. 20 micron imaging) would be necessary. Peter Kamphuis used something like that on…you guessed it NGC 891.
The correlations with SSFR is a first good exploration. I am curious to see what the survey team is going to be working on next!
No comments:
Post a Comment