I already talked about Rubin’s Galaxy, the largest disk galaxy in the Local Universe before. It remains a really fun galaxy to study in detail with other instruments. And that is what my collaborators on this (longstanding) project recently did:
A multiwavelength overview of the giant spiral UGC 2885
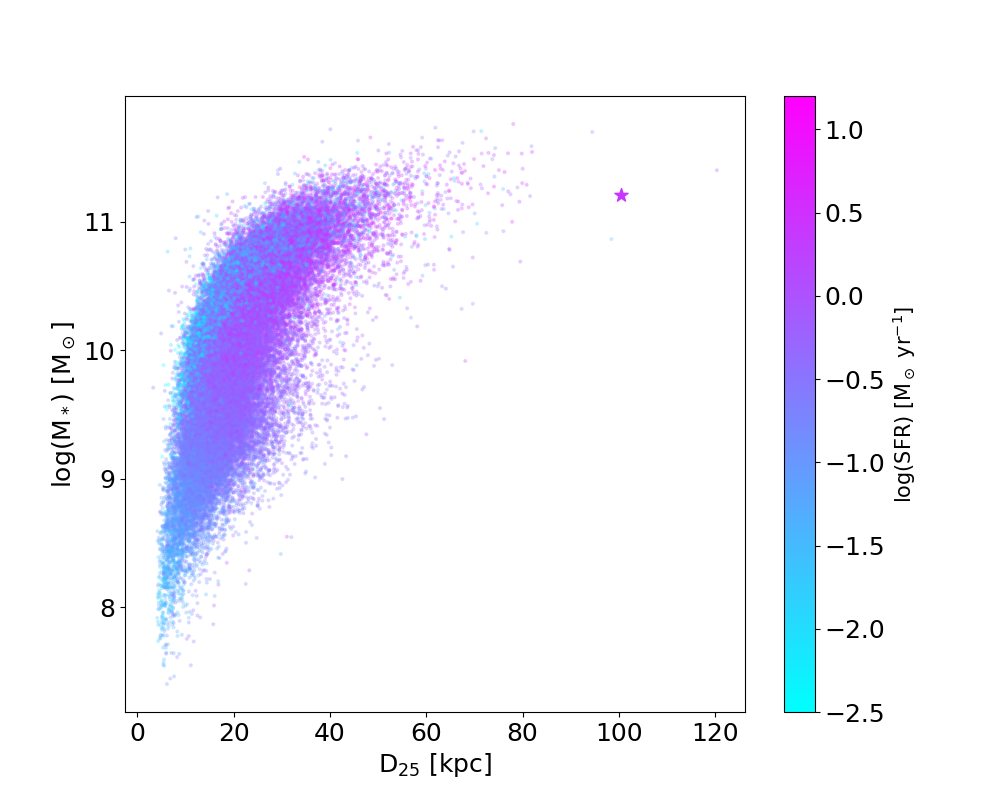
The first figure, just to establish that indeed Rubin’s Galaxy is a frikkin giant.
This was a good paper to collate all the stats on this galaxy in one spot. This will make it easier to refer to when we will study the gas supply and star-formation rate of this galaxy in the rest of the paper. The underlying idea is that it may point to how low surface brightness galaxies are perhaps a different mode of star-formation in galaxies.
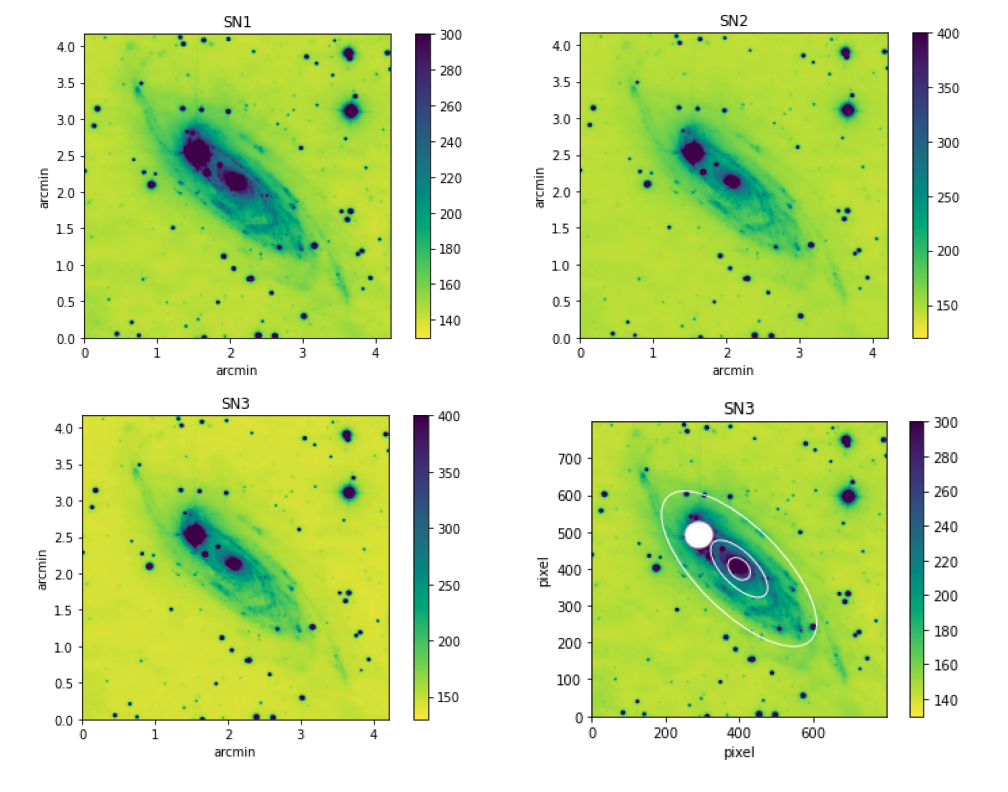
First new observations: SITELLE. This is a unique instrument in that it is an IFU but works interferometrically. Short bandwidth (wavelength range) but the longer you observe, the higher your spectral resolution becomes. Wild!
The SITELLE mapping of Rubin’s Galaxy in three narrow wavelength ranges.
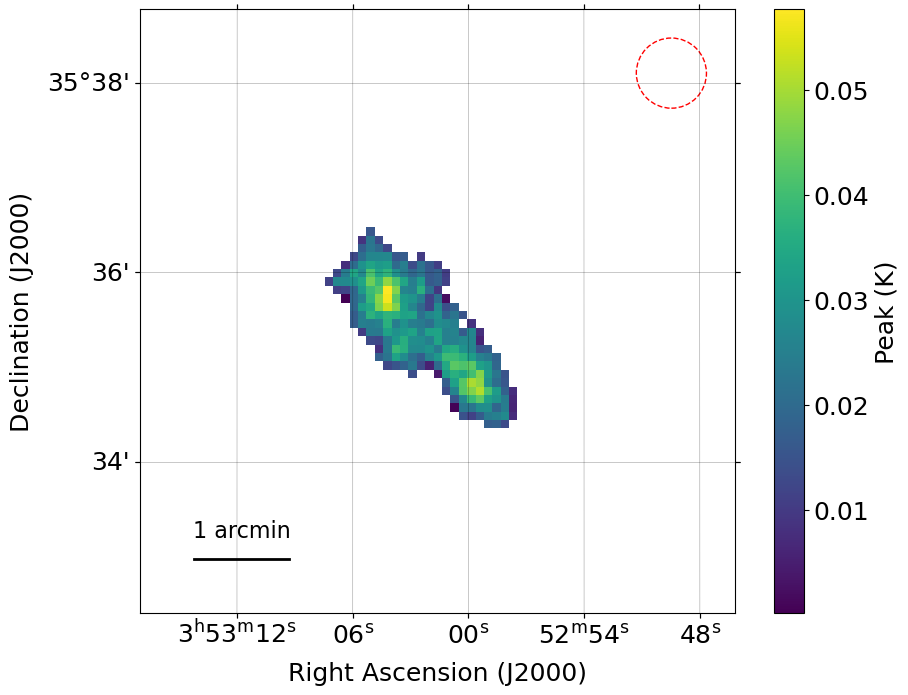
Second instrument is CO measurements using IRAM. This is to establish the molecular hydrogen reservoir. We already have HI observations of this galaxy.
The IRAM map of Rubin’s galaxy.
The IRAM observations also give a rotation map.
Blue and red map but not about elections. Galaxy rotation observed!HI and IRAM observations combined: all the gas fit to form stars.
The SITELLE observations gave us a — spatially resolved — map of the metallicity of Rubin’s Galaxy. It is mostly metal-poor.
So between the gas map and the current star-formation rate across the disk. The SFR was measured from the WISE fluxes.
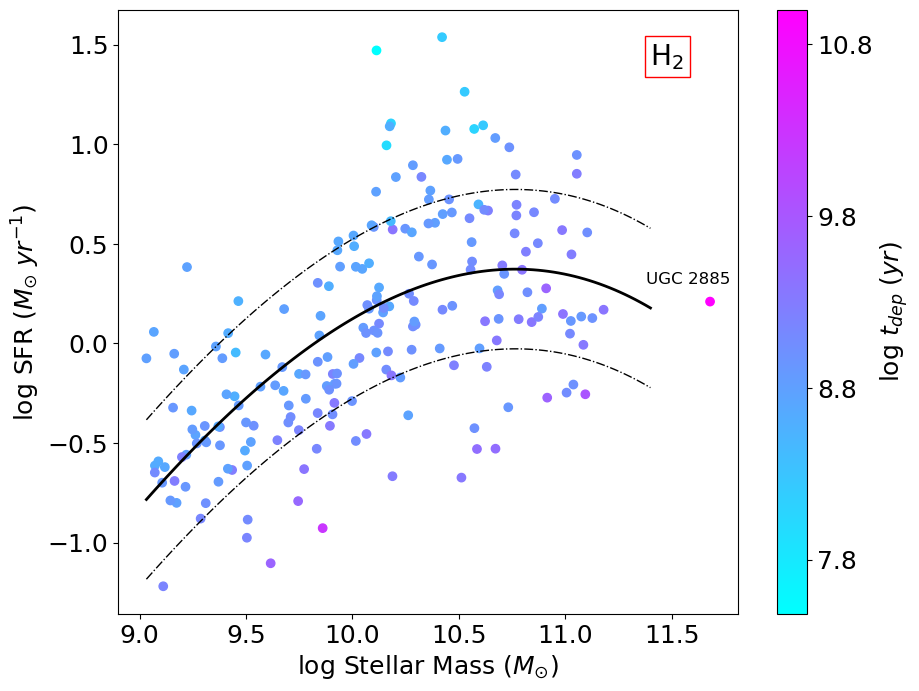
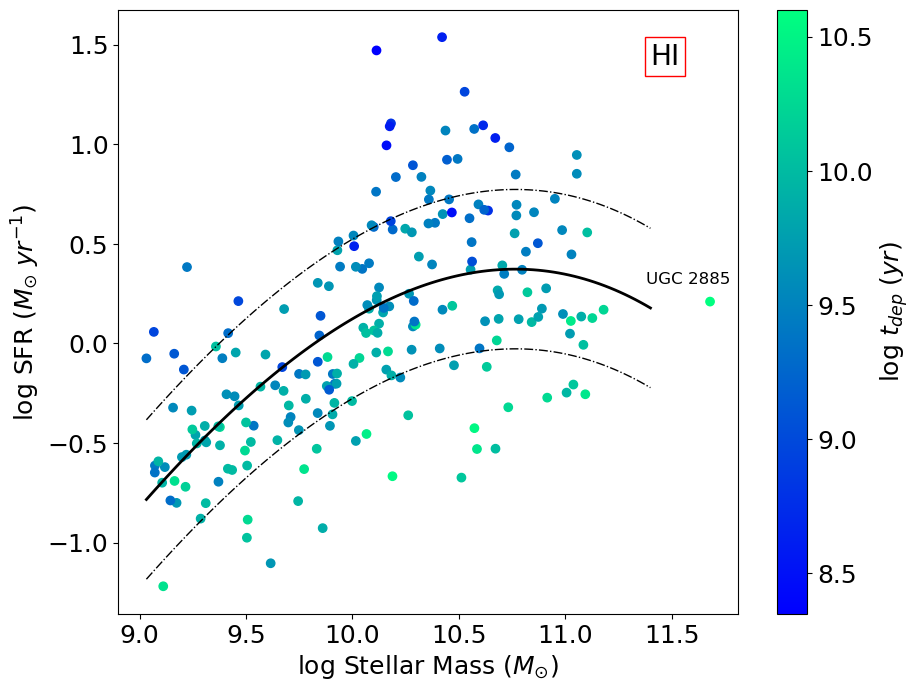
So at the present consumption rate, how long will it be before Rubin’s Galaxy runs out of fuel?
The stellar mass and star-formation rate of galaxies and Rubin’s Galaxy, color-coded by depletion time of the H2 (molecular gas) supply inferred from IRAM observations. Over 10 billion years!The stellar mass and star-formation rate of galaxies and Rubin’s Galaxy, color-coded by depletion time of the H2 (molecular gas) supply inferred from HI observations. Over 10 billion years!
Rubin’s galaxy has over 10 Billion years of fuel left in the tank! Well over a Hubble time, the current age of the Universe!!
This paper is a short letter pointing to the spectroscopic confirmation of a dusty dwarf at z=5. There are a few things remarkable about this object. It’s a metal- and dust-rich dwarf galaxy. Those are supposed to be metal poor and pretty much transparent. And that this galaxy is doing this at z=5!
The evidence for both dust extinction and the metal content comes from spectroscopy with James Webb Space Telescope for the Cosmic Evolution Early Release Science Survey (CEERS). JWST will make spectroscopists of us all yet.
The spectrum of CEERS-14821. These optical emission lines, emitted in the infrared at z=5, redshifted to 2–5 micron by the time they were observed with JWST NIRSpec instrument.
Dust
The dust in this low-mass galaxy does two things. First it does not show in Hubble images. There could be a whole population of these at higher redshift that we are missing up till now!
Secondly, it reddens the emission that we now see with JWST. This was the optical emission (rest-frame optical means it was an optical photon when it left, the travel from z=5 to now means it’s been redshifted to infrared when we detect it. Travel is hard on these poor photons).
We measure this reddening with the ratio of two emission lines from the Hydrogen atom: H-alpha and H-beta. If this is a “normal” 40.000K plasma around newly formed stars, these lines are shining in an expected ratio.
However, the longer wavelength one will be dimmed preferentially by interstellar dust. The observed ratio between H-alpha and H-beta thus tells us how much dust reddening happens(very similar to a sunset next to a refinery).
The full CEERS catalog with stellar mass and dust extinction AV. AV above 1 is optically thick; it is near impossible to see through this galaxy, with much of the starlight absorbed. This dwarf, CEERS-14821 may be a prime example of perhaps a population of such galaxies.
The two stars (green and red) are the amount of reddening in this small dwarf galaxy (I mean that is 100 million solar masses, its small). It shows that this galaxy is optically thick. There is no looking through this thing.
Metals
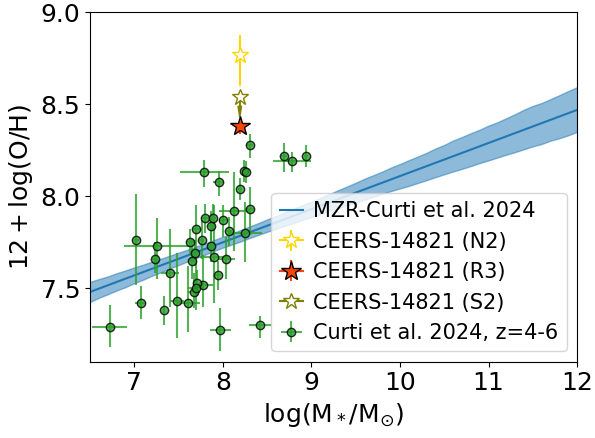
And secondly, the ratio of emission lines of Hydrogen and Oxygen tells us what the level of heavier elements is(astronomers call everything heavier than Helium a “metal”. Most of it is Oxygen anyway. Drives Chemist nuts).
The stellar mass and metallicity plot for a sample of z>4 galaxies and the new dwarf. Metal-rich dwarfs may be quite common at this redshift.
And as we can see our dwarf CEERS-14821 is high on the y-axis, which is the ratio of Oxygen over hydrogen. Lots of dust and lots of metals.
And now on why that is weird: small galaxies lose their interstellar matter quite easily. One supernova and poof, it’s blown out. A bigger galaxy is near, they lose it to that. Meanwhile this one has kept a lot of it.
If this was a unique case, that would be one thing. But at z=5, it is entirely possible that these dusty, metal-rich dwarfs are a common sight. It could well be that a lot of star-formation at that redshift is happening in these dusty dwarfs, hiding much of this from our observations up till now. How that first build-up of galaxies and stars works is still quite a mystery.
Galaxy morphology changes once you go to a different color. You are more sensitive to different stellar populations. Blue filters pick up young, massive stars for preference and redder filters the older population of galaxies, one is more sensitive to star-formation, and the other overall stellar mass (something the S4G survey used to great effect).
This brings me to the narrow-band magic. Narrow filters are only sensitive to a short wavelength range. But if an emission line happens to lie in that range, the contrast for those images will be fantastic.
This is the idea behind the Merian Survey and what this week’s paper is all about:
A Nonparametric Morphological Analysis of Hα Emission in Bright Dwarfs Using the Merian Survey
The two filters used, each capturing either Halpha or Hbeta+OII. So instead of a morphology estimate that is dominated by stellar populations, the morphology of your images is almost exclusive the emission line. These emission lines, especially Halpha, is powered by new star-formation. So this survey maps new star-formation in nearby galaxies and where it occurs. They combine their observations with a local estimate of the stellar continuum from z-band.
The optical image, narrow-band image, the continuum contribution and the line emission image of galaxies of this survey. This is a neat way to map lots of galaxies fast!
This allows for a clean segmentation of the image. The issue with Halpha imaging is often that it is very fractured. Individual HII regions are not inter-connected. So it is hard to define the part of the image over which to compute…drumroll please…morphometrics!
some of the segmantations of the images. Continuum defines the area, and then the morphometrics can be calculated over the Halpha flux.
One can then start exploring the HII morphology space and its dependence on inferred galaxy properties; stellar mass and overall star-formation rate or combine these into specific star-formation rate (SSFR).
The Gini-M20 plane with Asymmetry color-coded to show where Halpha and sdss-r contunuum light morphology lie for the sample. Note that the continuum lies in the disk galaxy space, but Halpha shows a much greater range.
This is the Gini-M20 space that Lotz+ has used to identify disks, spheroids and interacting galaxies. The divisions look to be very different in Halpha morphology though!
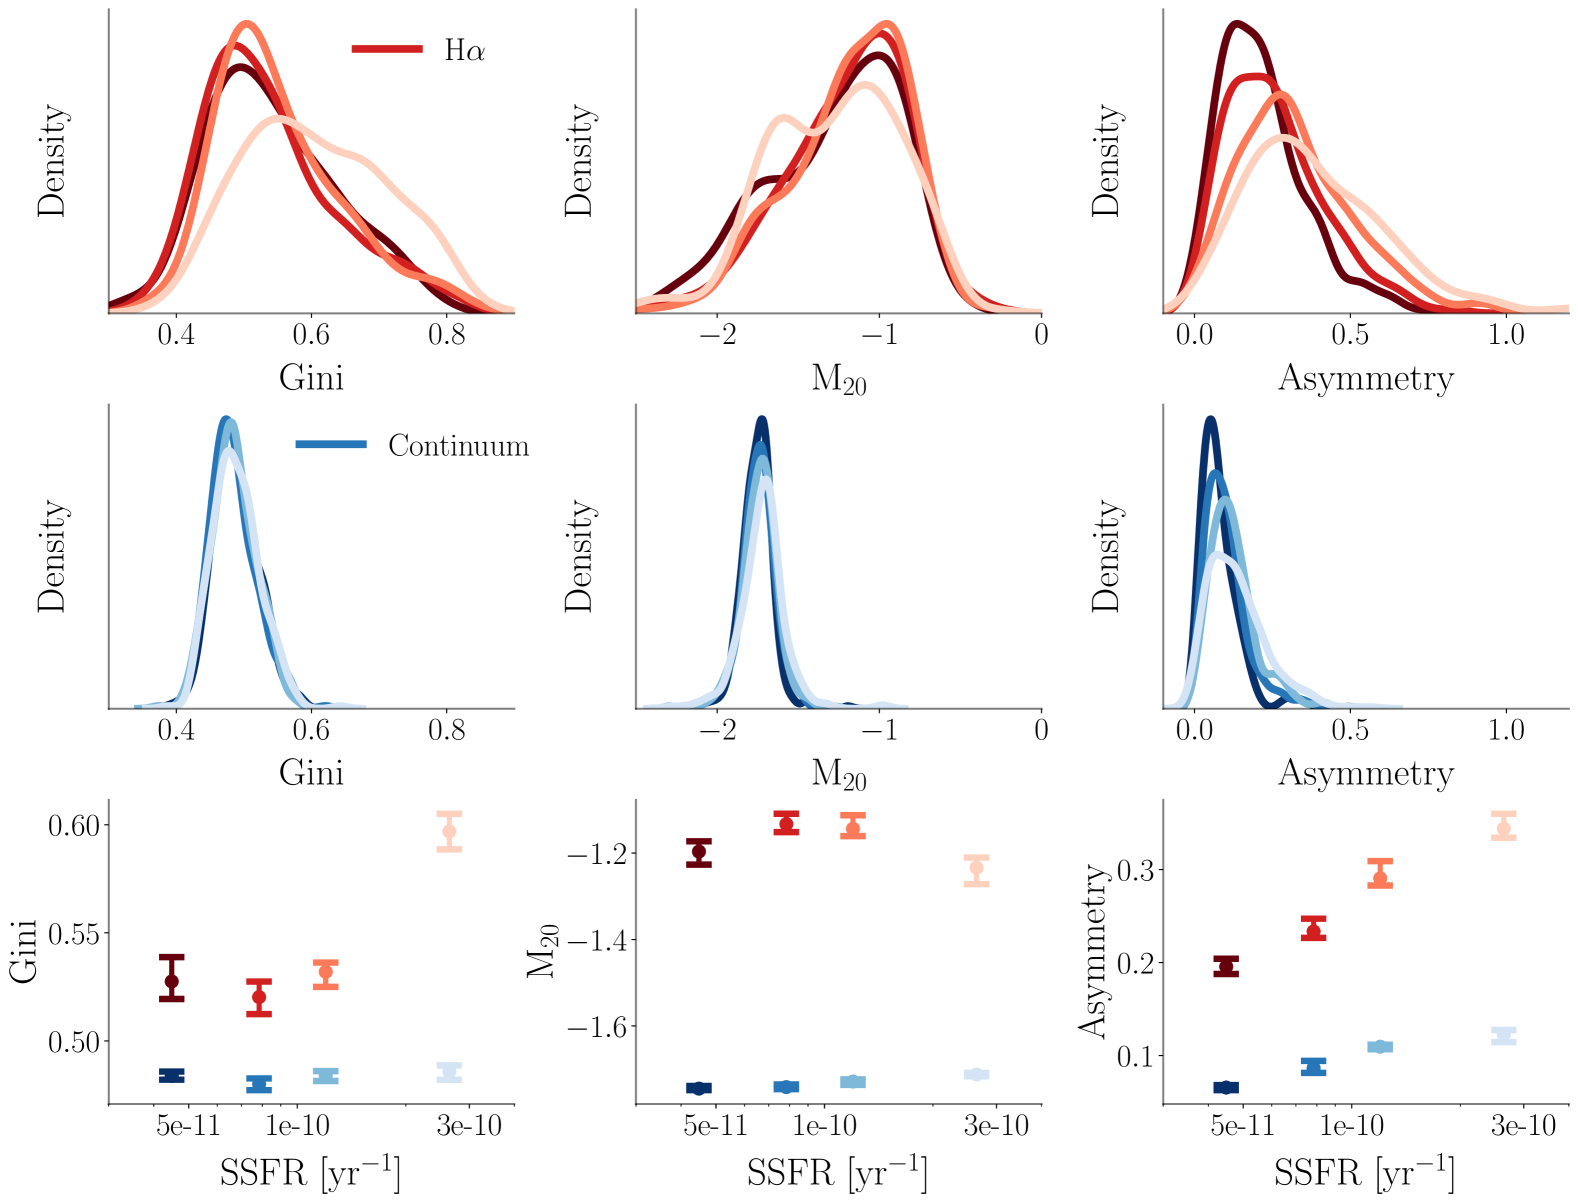
The distributions of morphometrics as a function of stellar mass. These seem to not change much with mass.The morphology in Halpha does seem to change a lot with specific star-formation. No surprise since Halpha is driven by star-formation. If there relatively a lot of it, the morphology changes. Even if the underlying disk is not very perturbed.
The potential weakness is that the view of Halpha is skewed by dust. The authors address this and correct for this some. But to correct the morphology completely for that, commensurate hot dust (e.g. 20 micron imaging) would be necessary. Peter Kamphuis used something like that on…you guessed it NGC 891.
The correlations with SSFR is a first good exploration. I am curious to see what the survey team is going to be working on next!