Monday, September 30, 2024

Big Wheel Galaxy

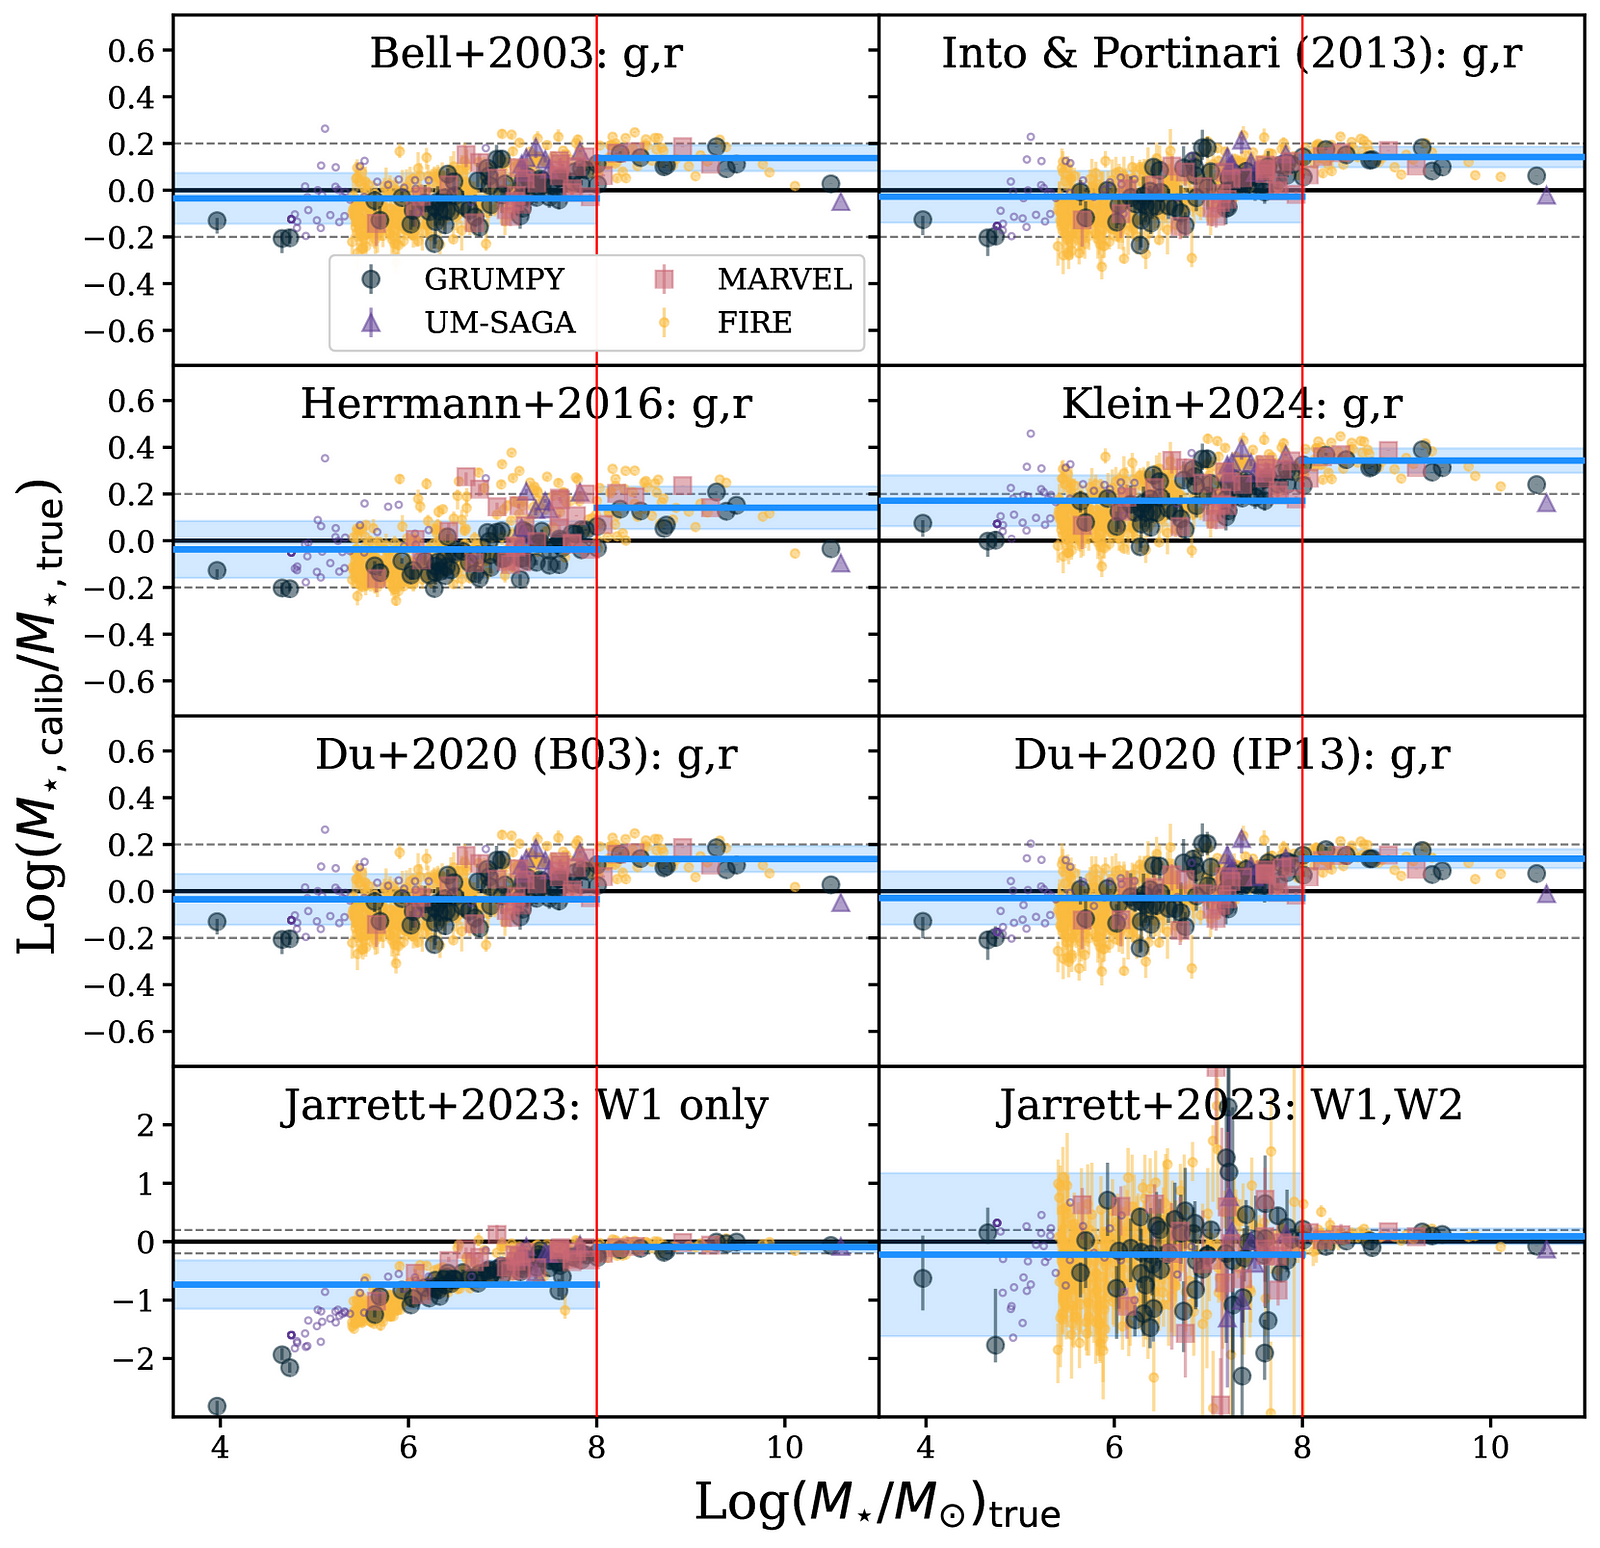
 Spiral galaxies come in all sizes. One of the more impressive things about them is that over 6 orders of magnitude they are self-similar. Meaning that unless you had an inkling of the distance, all disk galaxies are exponential declining light profiles, rotate with similar (enough) rotation curves and basically look the same. 

But up to a point right? There is such a thing as too big a disk galaxy. Extremes can be very informative in an observational science so what are the biggest disk galaxies at a particular time in galaxy evolution? 

Locally the biggest disk galaxy title is held by “Rubin’s Galaxy” (UGC 2885), named after Vera Rubin. This is one I studied together with my collaborators extensively (some of the papers were going to come out in 2020…). The amazing thing about this galaxy is that despite that it is 10x the mass and 5x the size of the Milky Way, it neatly lies on all the scaling relations for disk galaxies! It’s an Sc galaxy…just…really big.

The Hubble mosaic of Rubin’s Galaxy, UGC 2885. Rubin originally pointed out in her other 1980 paper that this was an unusually large disk galaxy. It shares the title of biggest disk galaxy with Malin 1, an low surface brightness disk. How such a disk galaxy grows over time and importantly, stays a disk is a key point my collaborators and I hope to learn more about. 

And there is a class of big spiral galaxies called “super-spirals” of about the same size and mass (log(M*) ~11.5). Those are often quite perturbed looking and are assumed to be the result of a merger where the disk miraculously survived. 

This brings me to the paper this week: 

A Giant Disk Galaxy Two Billion Years After The Big Bang

[astro-ph]

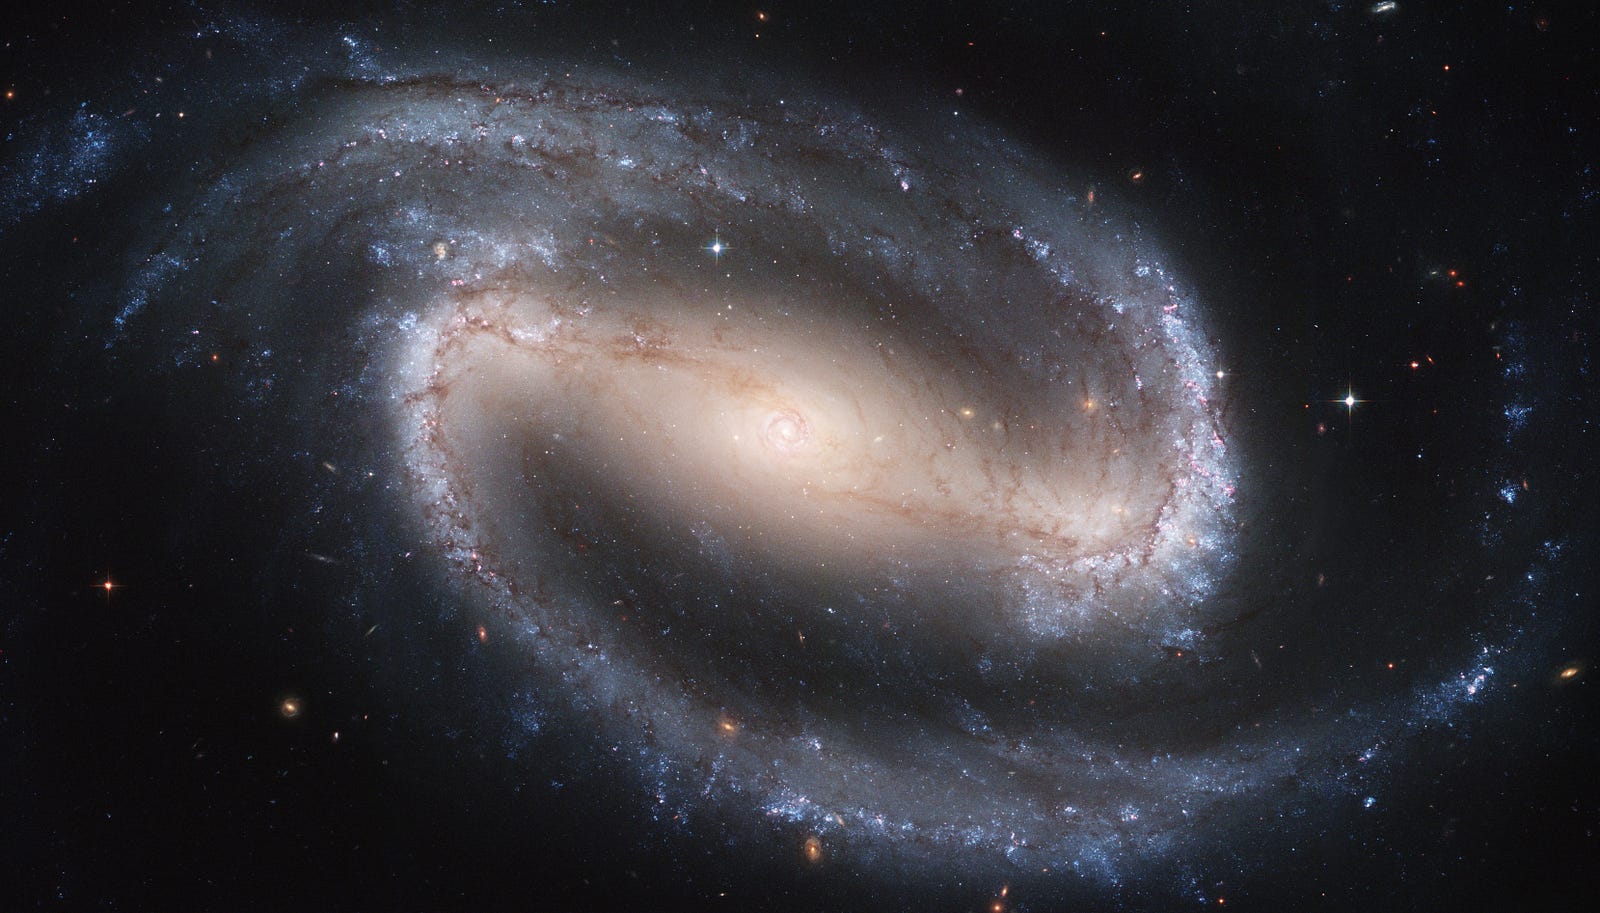
This guy: the Big Wheel Galaxy at z=3:

The discovery image highlighting Big Wheel.

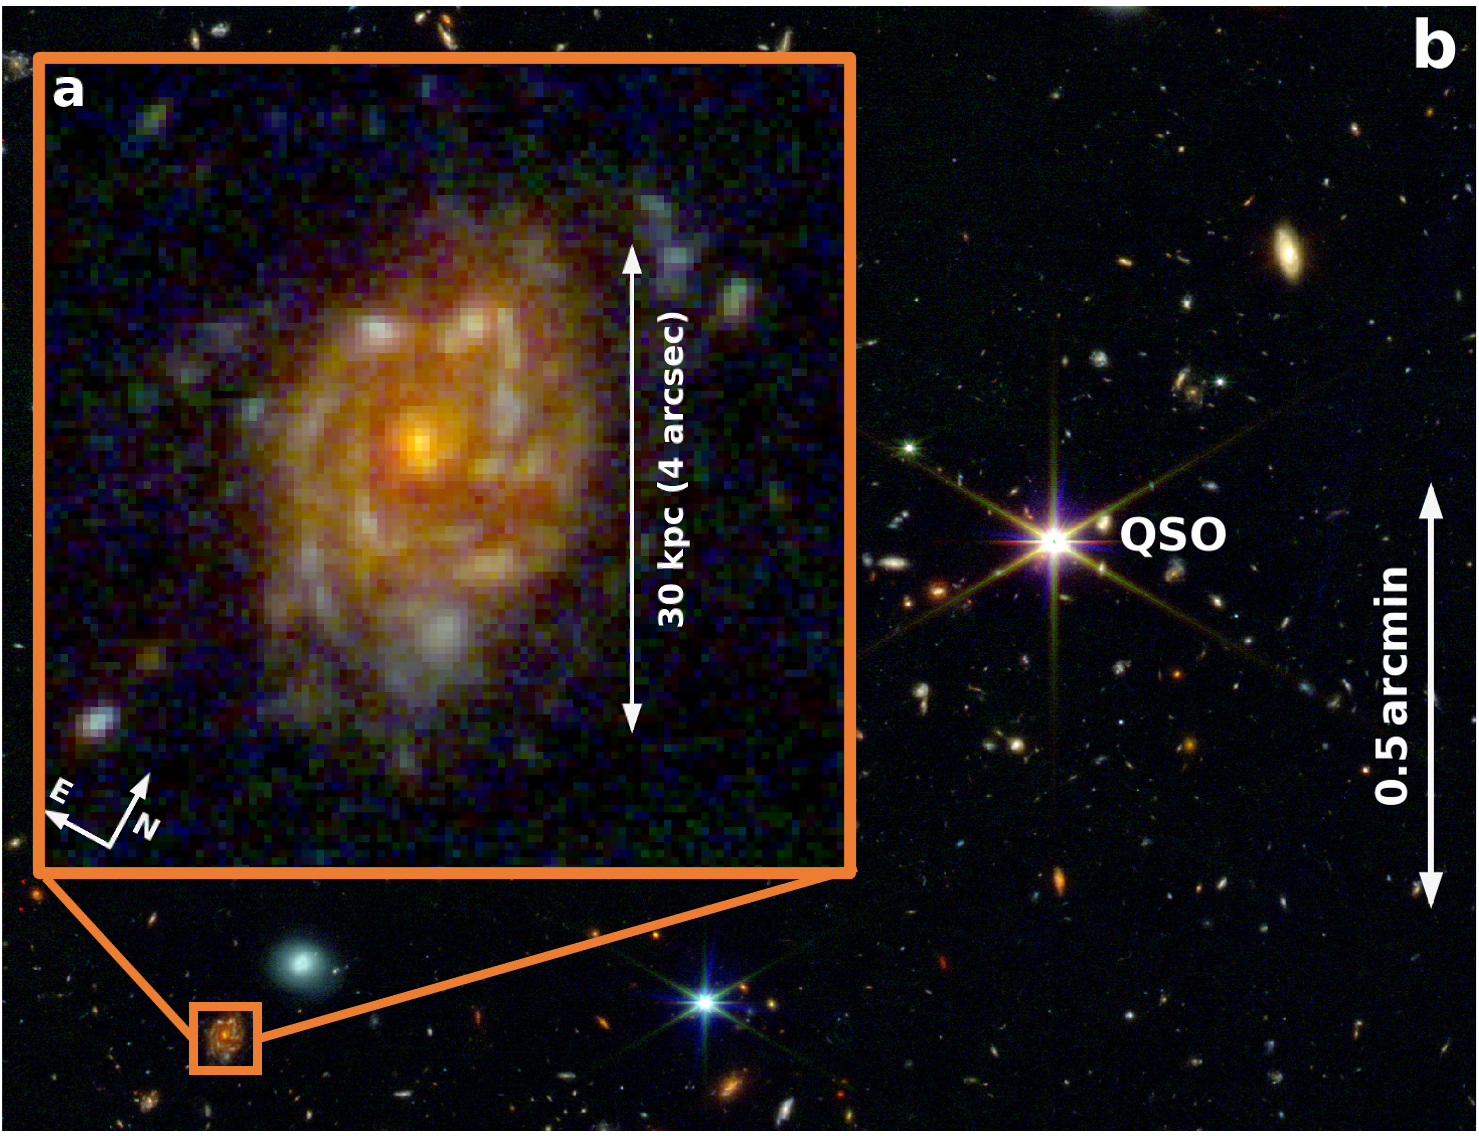
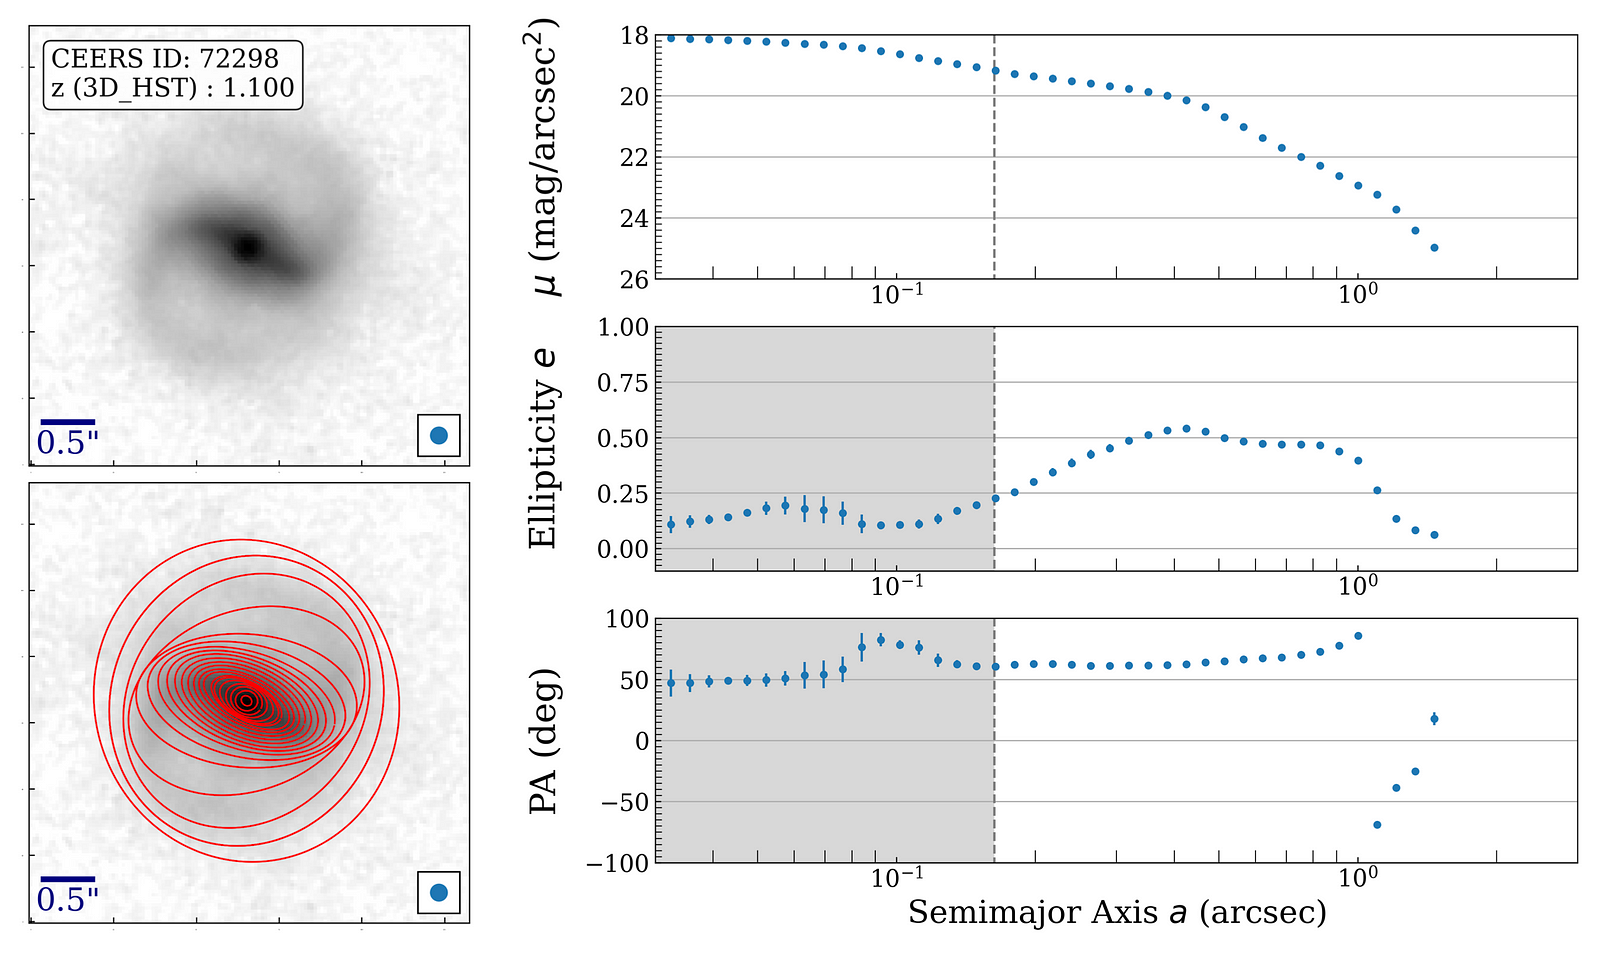
A big disk like that at high redshift is a prime target to see if disks rotate still the same in this much earlier epoch. So the authors targeted this disk with three slit observations for rotation. And indeed there it is; rotating pretty much like a local galaxy. 

Kinematic long-slit observations. These may or may not capture the turnover point for a rotation curve. Pretty convincing curve though. 

With distances, morphology, and now kinematics from HII regions (just as V. Rubin found her rotation curves in the 1970’s), this galaxy can directly be compared to the scaling relations in the local Universe. 

Scaling relations for z=3 galaxies and Big Wheel. The galaxies is more extended (top panesl) than one expects from trends. The star-formation rate is where one would expect it to be at z=3. The kinematics however resemble more a settled z=0 disk, a super-spiral, than z=3 disk galaxies observed so far. 

And while it lies in the same mass-range as Rubin’s Galaxy or the super-spirals from Ogle+ 2015,2019 and Di Teodoro, it looks like a normal disk galaxy in most measures for a z=3 galaxy (star-formation rate) but it is much more extended for its mass than z=3 galaxies. 

I wonder how Big Wheel (Tori Amos fan, the authors?) will evolve. Will it become an LSB giant? Something like Rubin’s Galaxy? Or will a disk not survive the 10 Billion years of further evolution? 

To become Rubin’s galaxy, star-formation would have to crash, a drop of about 2 orders of magnitude. Other than that, it has a similar rotation velocity and stellar mass! And frankly, a very similar morphology (4 arms, Sc galaxy. Even our view of it (inclined) is similar. 


Sunday, September 22, 2024

Weighting Dwarf Galaxies

 How much stellar mass is there in a galaxy? We see a certain amount of light from galaxies and that implies a certain number of stars. It depends on the mix of stars and the redder, the easier the conversion is (less dust, or over-weighting blue, short-lived stars).

A neat visual from https://indianexpress.com/article/technology/science/massive-galaxy-dark-matter-8850839/

And honestly, the problem of weighting the stellar mass of galaxies had shifted into the “solved problem” category. Not perhaps something to get complacent about but no longer estimates what were orders of magnitude off. I quite clearly recall a talk where the uncertainty was set at 0.2dex (less than a factor 2) for any survey. 

But that was for big galaxies, that have been around a long time. Think Milky Way and bigger. We studied those the most, we understand those the best. We are entering the era of the Dwarf (insert obligatory Tolkien or Rings or Power reference here). We will observe many more dwarf galaxies in the near future and understanding dwarf galaxies is critical in our understanding how galaxies form, reionize the Universe, and coalesce into bigger galaxies. 

And stellar mass estimates for dwarf galaxies…well…

This was a problem that was neatly show at the NASA Galaxies Science Interest Seminar by Professor Mia de los Reyes: YouTube

Which brings me to this week’s paper and one I was looking forward to:

Stellar Mass Calibrations for Local Low-Mass Galaxies

Mithi A. C. de los Reyes et al.

[astroph]

Which addresses how well each stellar mass conversion works for dwarf galaxies that we have made in simulations. This has a few benefits: first you know the ground truth (the galaxy is in your computer) and secondly, it allows you to sidestep any issues with photometry between different surveys. Gotta keep track of all the systematics and here is one specific one you want to tackle. 

The traditional photometry to stellar mass estimators. I can think of at least one more but this neatly shows how a luminosity and a single color is converted into a stellar mass. Works okay for massive galaxies, starts to introduce significant biases and error in the lower mass regime. 

The first is straight-up conversion from one filter and a color into a mass. As you can see, in the dwarf regime, the deviation from true is dramatic, often quite dire. This will work okay for your survey of big galaxies or even Milky Cloud Galaxies (Dr de los Reyes is a proponent of calling these not after Magellan anymore, see here). 

Correcting the bias can be worked out but a noisy relation remains. Perhaps that is sufficient for your purposes. It may not be. 

But knowing this, one could, conceivable, calibrate this conversion (this mass-to-light ratio) and make it mass-dependent. As the plots above show, it can be fixed. Some. 

But we rely on full Spectral Energy Distribution modeling these days to get stellar mass, dust mass, star-formation rates and increasingly, star-formation history and metallicities as well. How do these do in the Dwarf regime? Below are a few different star-formation histories. Each a different function of the age of the galaxies and how many stars it produced at that time. 

Parameterized star-formation histories going into SED fits. These are simple functions like a constant, an exponential decline or an exponential decline with a single spike. These are very significant assumptions to make of the shape of a SFH (e.g. it must be declining) for the sum of the history is the mass we are after.
A more flexible approach is the non-parametric (a misnomer I feel, there are parameters, just more of them?) to allow for all kinds of shapes for the SFH. Hopefully constraining better the kind of total integrated mass from these histories. 

There are even less parameterized functions to account for the star-formation history. There are some in the above plot.

The point is that there is still an offset. Not massive in terms of big galaxies, but critical if you want to understand smaller galaxies. It those are suddenly all under-estimated, your whole study can be critically biased. 

I think a systematic approach such as this one, is present-day extra-galactic science at its best. A methodical study of the inherent noise and bias in our estimates. I have always been a bit nervous about the fact that so many of our SED codes are effectively calibrated on NGC 891 and maybe the Sombrero and Arp 220. This is getting better but one worries about the effect of the survivor bias in what was studied in detail.


Saturday, September 14, 2024

How long has that bar been there?

Disk galaxies often have a “bar” at their center. A rectangular shaped, often yellow-ish structure. We understand this is a bunch of the older stars in the disk moved from circular orbits to highly elliptical ones. 

NGC1300 the original barred galaxy. There are many like it.

Now this leaves us with a few questions: how often does this happen? That is something the GalaxyZoo project can help you with. That would give you visual classifications and those can be quite good. The other way to find out is to fit isophotes (lines of equal amount of light) to the galaxy. The Bar stands out as highly elliptical isophotes and the position angle of those ellipses radically changes at the edge of the bar. It leaves a clear signal. Like in the galaxy below. 

The isophotal method of bar detection. The ellipticity drops when outside the bar and the position angle goes all over the place (see at 10⁰) 

This brings me to this week’s paper: 

The Abundance and Properties of Barred Galaxies out to z∼ 4 Using JWSTCEERS Data

Yuchen GuoShardha Jogee, + CEERS team

[astroph]

Where the CEERS team looked at galaxies far away, as seen with the JWST. The benefit here is that we can do this exact analaysis to much greater distances and thus lookback times. This brings me to the other question: how long have galaxies had bars? That can be trickier to answer and there was quite a bit of disagreement with the early Hubble studies. I was impressed with these, cleverly using the above type of analysis on Hubble fields and calibrating the counts with local galaxy images to see how many bars had been missed. But Hubble has its limitations and beyond redshift z~1 would be too challenging for Hubble’s cameras and their wavelength range. 

To recap, one can find bars visually or with the isophotal technique. There have been many studies using Hubble and now a few with JWST to expand the range to much higher redshifts. The observational situation is as follows:

The fraction of bars of a population of galaxies observed with Hubble (small symbols, many different authors) and the few JWST studies and the two done by Gao+ in this paper. The visual and isophotal techniques agree pretty well and if JWST is to be believed, bars were already present in substantial numbers at z~1. This definitely pushed the appearance of bars up. 

Bars in the present day is ~40% of all disk galaxies. But as we look back over the last 10 Gyr, the fraction drops to 10% or so. What is amazing is that there seem to be bars already at z=3.5. Some have been reported even further! That would make bars something that could form much earlier and perhaps stick around for a much longer time than we thought? 

We are still not done though. Are these bars the same bars we see locally? Do they spin around the disk at similar speeds? Do bars from slowly at first and then a lot in the past 5 Gyr? Are bars just a phase or a longer, sustainable pattern in a disk? What is remarkable is what we can also see: a galaxy 1 Gyr after the Big Bang can have a bar in a disk. That pattern establishes itself early.