In a previous blog post I gushed about the wonderful new JWST data on NGC 891, an edge-on galaxy with an ultraviolet halo. This week I’ll talk about this paper:
Illuminating the Incidence of Extraplanar Dust Using Ultraviolet Reflection Nebulae with GALEX
The authors use archival GALEX data to look for ultraviolet light from well above and below the plane. One of the authors has already done so with H-alpha, the emission line of ionized hydrogen. The idea is to look of blue light tracing star-formation can be seen well away from the disk of the galaxy seen edge-on.
A figure from Seon+ 2014 on NGC 891 (yes that one) showing the UV coming from more than just the thin disk.
This is important because we think there is no star-formation there. So if we see the blue or ultraviolet light there, it must have reflected off something: high latitude dust clouds. Also called cirrus or galactic cirrus. And apart from a lot of paper on NgC 891 (including a few I’m involved in) there isn’t a lot of evidence of galactic cirrus in other galaxies.
This is why this is a nice and clever paper. They collected all the edge-on galaxies for which there was GALEX data, examined them all individually and found 7% have this extra-planar UV halo. Earlier authors [] also found similar incidence rates. But GALEX is not very high resolution data so it’s hard to tell. In this paper, they also stacked all the data to look for a UV halo. The authors conclude the scatter off cirrus is much more common than 7% and there is UV light coming from well above and below disks.
They relate this to mass and star-formation rate of the galaxies here:
Figure 15 from the paper showing the vertical profile stacks for different star-formation rates.
This figure above shows the absolute star-formation rate, I would have asked for a relative (specific) star-formation rate as well. Do smaller galaxies with relatively more star-formation produce more cirrus?
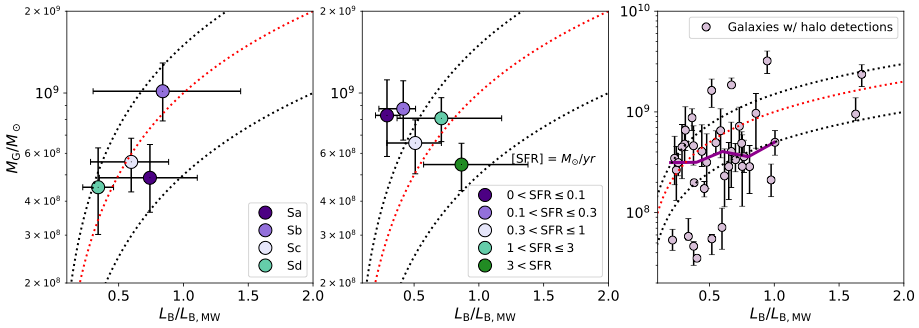
The authors link the mass, star-formation and the amount of gas extra-planar in this cirrus.
The normalized luminosity with respect to the Milky Way on the x-axis and the amount of extra-planar gas implied on the y-axis. On the left and middle are the stacked results — either by type or star-formation rate — and on the right are the directly detected cirrus UV reflections. The lines are assuming 5,10 or 15% of all the disk gas is in the halo. There is quite a bit of variety with disk luminosity!
Unfortunately, this will be it until we get more ultraviolet imaging. Maybe with SWIFT (not the singer) or a new NASA mission UVEX. The latter is set to observe the whole sky, deeper and in high resolution. That will give us the kind of data one can use to study the galactic cirrus in much more detail.
Ok so why do we care again about galactic cirrus? because this hints at a self-sustaining refueling mechanism in disk galaxies. The cirrus material is blown out, the metals and dust in that material helps cool hot halo gas and it all rains back down on the disk of the galaxy, triggering new star-formation!
And it is apparently pretty common. Maybe this is how disk galaxies get (much? Most) of their refueling!
Some galaxies get all the attention. This is often simply because it was the easiest to observe to begin with, nice and close, fit in the telescope’s viewer or told us something interesting thanks to our perspective.
In the case of NGC 891, it is all of the above. Easily seen from the Northern Hemisphere, it was the subject of a bunch of studies on the thickness of disk galaxies. It is perfectly edge-on and pretty close.
The vertical structure of galaxies is a subject unto its own. Why are disk galaxies so flat? What can we learn from the interstellar medium in these disks by studying from the side? My PhD advisor Piet van der Kruit used this galaxy to formulate how to describe the light distribution of galaxies for the first time back in 1981.
And it has been a favorite of astronomers (and myself) ever since. We have looked at this galaxy with every telescope that can reach it and any that was sent to space! Herschel, Spitzer, Hubble (Subaru is the one above). When I organized a conference on how to model dust in disk galaxies, we kept a tally how many people used this galaxy in their talk. It was nearly everyone! (good thing it wasn’t a drinking game).
There is gas sticking out of the plane of this galaxy (Oosterloo+ 2007) and early-on those dust filaments or fingers sticking out of the disk drew attention (Howk+ 1998/1999). Is that typical? We have often used the light from this galaxy to calibrate and benchmark the models that describe all galaxies (see Popescu+ 2000, Bianchi+ 2011). So what if this galaxy is not that representative? Back in 2007 for example, Peter Kamphuis and I worked out that we could see how much dust was out of the plane of the galaxy using the left/right symmetry above the disk in both infrared and H-alpha emission. Both originate from star-formation, so they should be similarly symmetric. Except H-alpha is more affected by dust. There was evidence for a dust component well above and below the plane (up to 2 kpc). I think that was the fastest paper I have ever been part of (from concept to acceptance in something like 3 months. It was fast!).
A figure from Kamphuis+ 2007: the blue light on the left does not go through as much dust and muck as the blue light from the HII regions on the right, so the H-alpha image was skewed towards more blue light from the left. Meanwhile the 24 micron image, also from the same HII regions, did not suffer from the dust and was mostly symmetrical left/right. From the difference, we could infer the vertical dust component of NGC 891.
So it is professionally very exciting to see a paper on NGC 891 with the latest and greatest telescope, the James Webb Space Telescope. The paper came out this week:
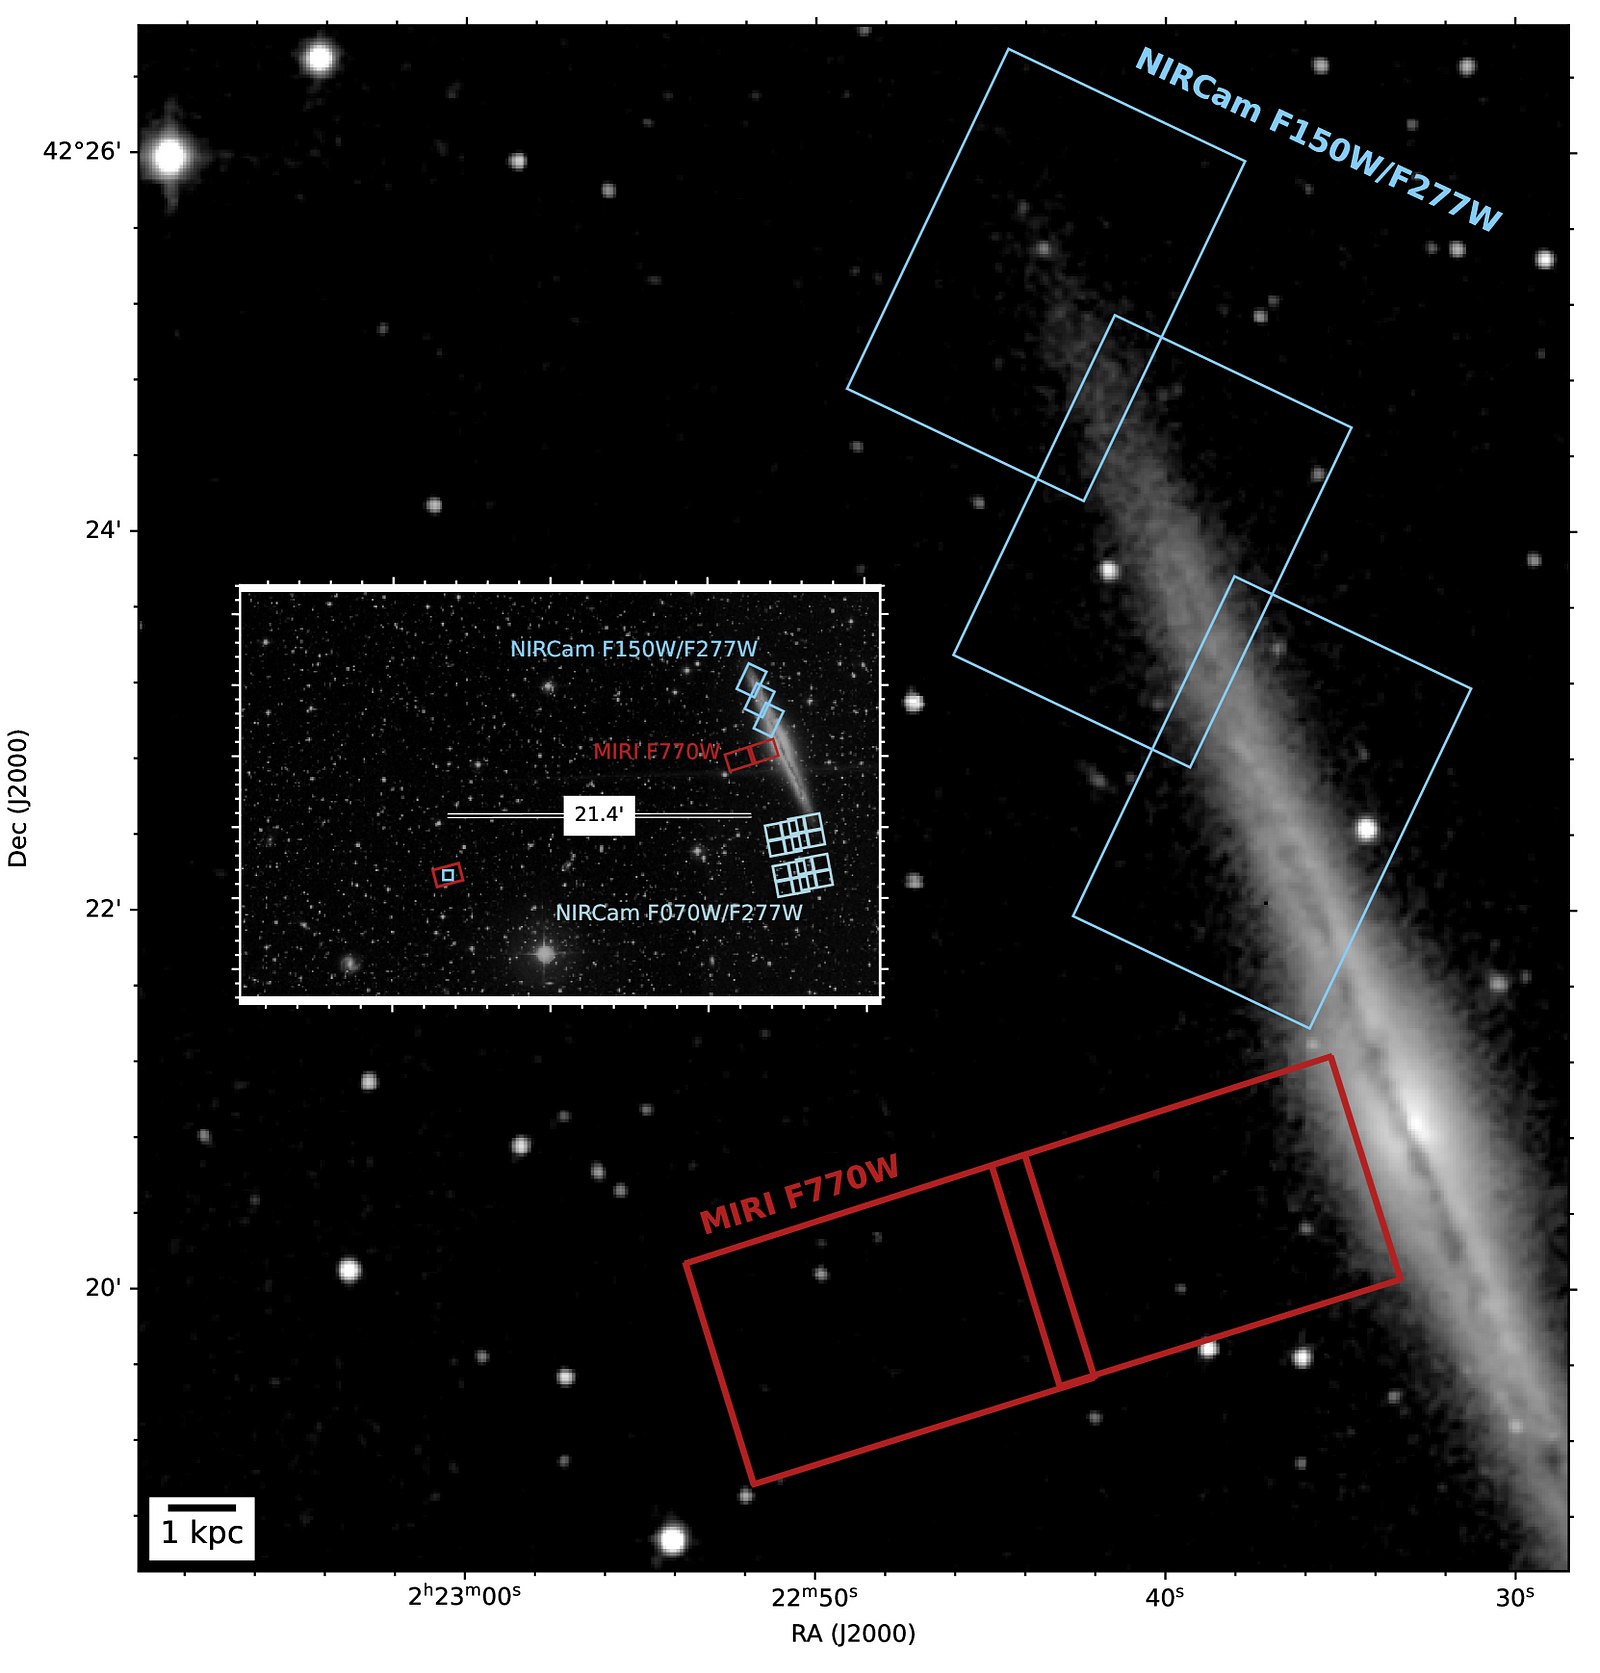
JWST MIRI and NIRCam observations of NGC 891 and its circumgalactic medium
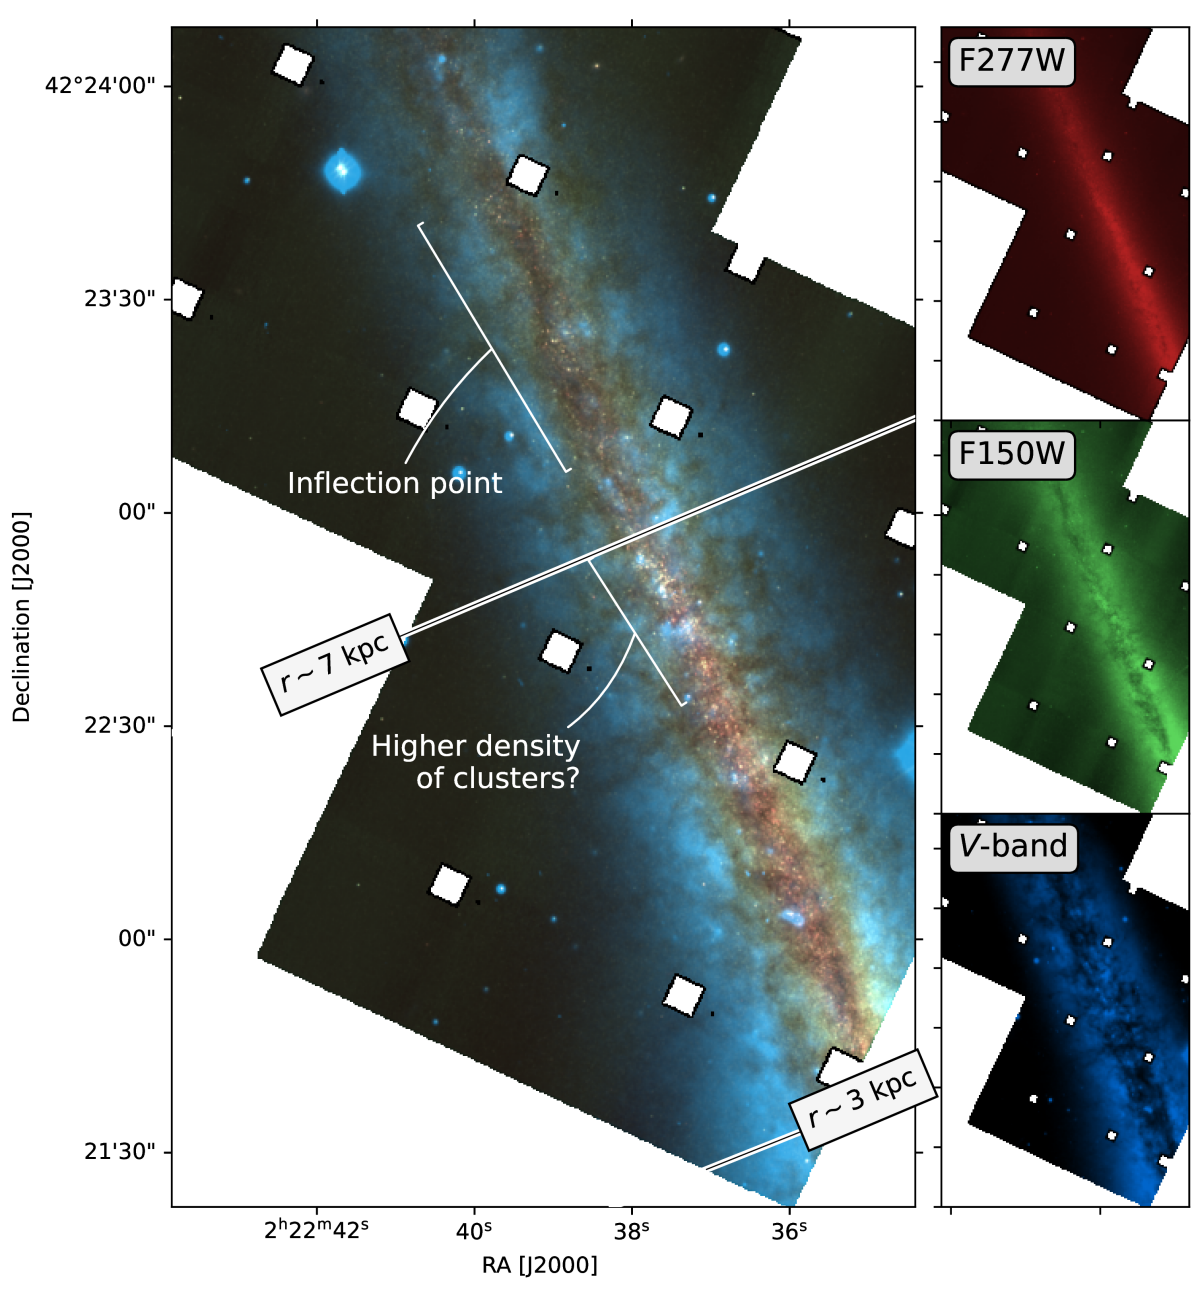
The James Webb Space Telescope observations of NGC 891.JWST can observe in amazing detail but the field is small: you have to put observations next to each other and still not get the whole galaxy. About 1/3 is observed with one camera NIRCam and a second camera MIRI is observing at the same time in the red squares. A false color image of NGC 891 using the NIRCam images and existing Hubble Space Telescope images for the blue channel.
Like a lot of great studies, this uses all the space-based information there is, including HST data for the V-band (blue). You can see the blue light peeking around all the dust in the central plane of the galaxy!
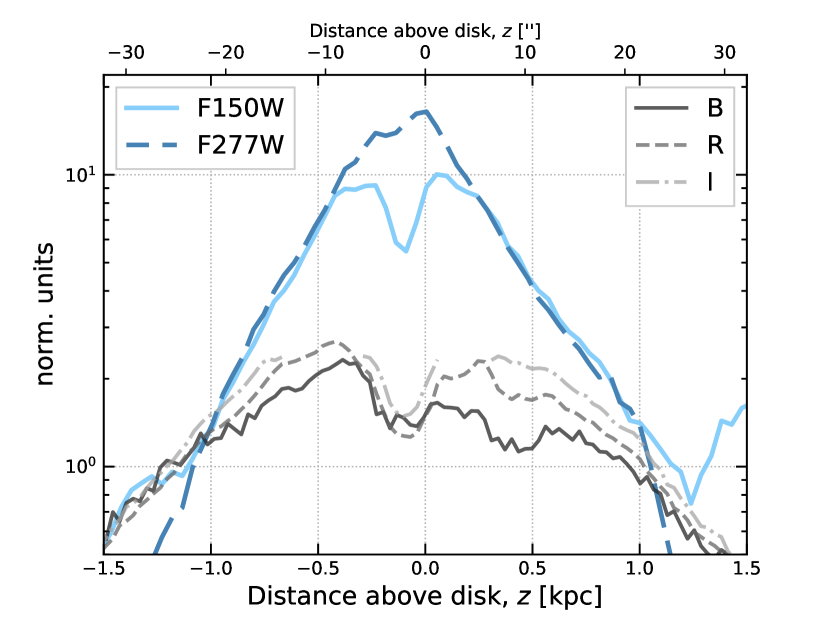
The vertical profile of NGC 891.
The vertical structure is very differnt in the infrared compared to the optical (BRI). The F150W is 1.5 micron and pretty close to the optical. You can still see the divot in there close to the centerline of the disk where dust absorbs light even at 1.5 micron!
This is why back in 1981, Piet van der Kruit “softened” the vertical profile some from exponential to something that had a smooth transition in the center (sech²) because of that dust in the plane.
There are two components to this study though: there is also the new MIRI observations at 7.7 micron, where big molecules called Polycyclic Aromatic Hydrocarbons emit light.
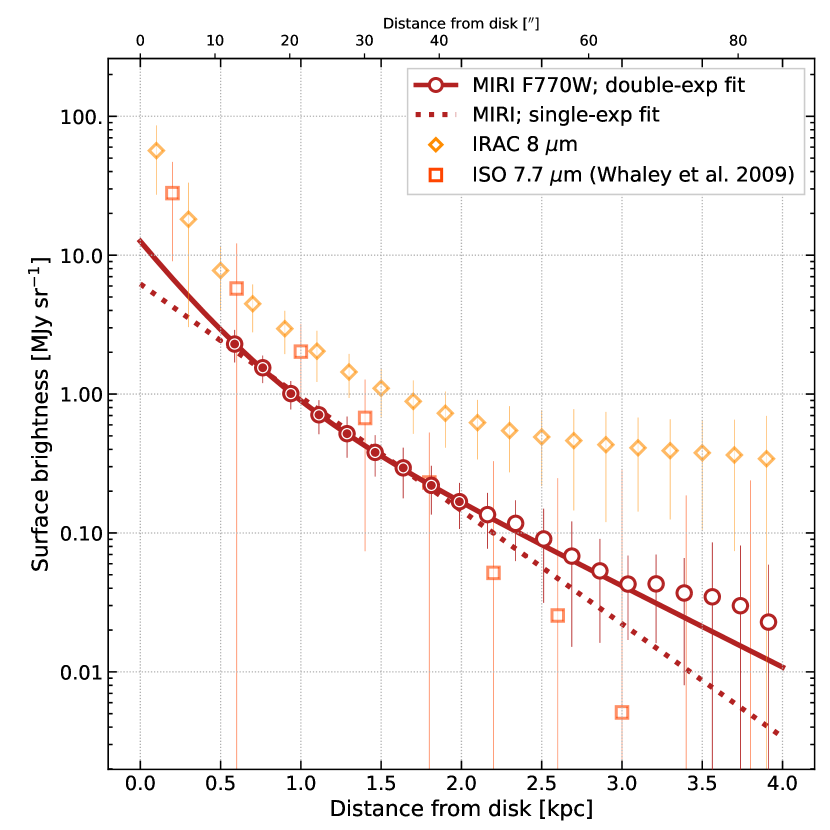
The vertical profile of the MIRI observations. This is well above the disk of NGC 891.
One of the open questions is “is there and how much of a thick disk?” meaning to explain the light, does one need one or two exponential disks to fit the vertical and radial profile. To give you an idea how much debate there was on these, here is a title from Comeron+ 2018: “The reports of thick discs’ deaths are greatly exaggerated Thick discs are NOT artefacts caused by diffuse scattered light”
And here with JWST, the best resolution you can get, there is clear evidence for a second component, also in 7.7 micron with MIRI.
But where we really start to learn new things is when we look at some of the detail the MIRI observations show:
Details of the MIRI image. You can see the arcs of material that are the edges of bubbles blown out by star-formation in NGC 891’s disk.
There are clear arcs of material coming out of the disk that have PAHs in them. This is the effect of star-formation blowing bubbles in the surrounding medium (a galaxy is called to be“evervescent” which litterally means “bubbly”). We see these bubbles now clearly with JWST/MIRI and well out of the main disk of NGC 891, out to 4 kpc!
This interplay between disk, its star-formation and how much material gets blown out is important in understanding how galaxies work, specifically how they get fresh gas to support all this star-formation. The material outside the disk mixes with the hot gas in the halo, the metals in the dust allow that gas to radiate away some of its energy and cool. Cooler gas can flow to the galaxy and start fueling star-formation. These bubbles can help sustain star-formation, without drawing gas from much further away!
This paper also makes some first inroads into connecting the star-forming clusters responsible to the bubbles we can identify. I think many more studies on NGC 891 with this exquisite data are in our future (drink!).
There are two ways to explore how galaxies have changed over time with telescopes: first is to look further and further back into earlier epochs. Thanks to the speed of light, the images of galaxies far far away is also from long long ago. That is what Hubble and now James Webb have excelled at.
The other is Galactic Archeology, identifying generations of stars in our own or very nearby galaxies and mapping out where they are within that galaxy. Our own Milky Way is both easier (we are in it) and harder (we are IN it) to do. Nearby galaxies, with deep and sharp enough images, can offer an opportunity to map where different stars ended up. How many metals were available at the time they were formed? Are they in the disk or further out? Especially the halo of stars around galaxies is believed to be made up of some of the oldest components, left over from when the first proto-galaxies collided into what is now the main galaxy. The long dynamic times (it takes foreeeever to cross that much space) means that these leftovers havent complete dissapated yet and can be identified as coherent groups of stars (unlike gas, the stars behave mostly as ideal particles in a gravitational simulation too, if you know where they are and where they’re going, you know where they’ve been).
Which brings me to this week’s paper:
A Timeline of the M81 Group: Properties of the Extended Structures of M82 and NGC 3077
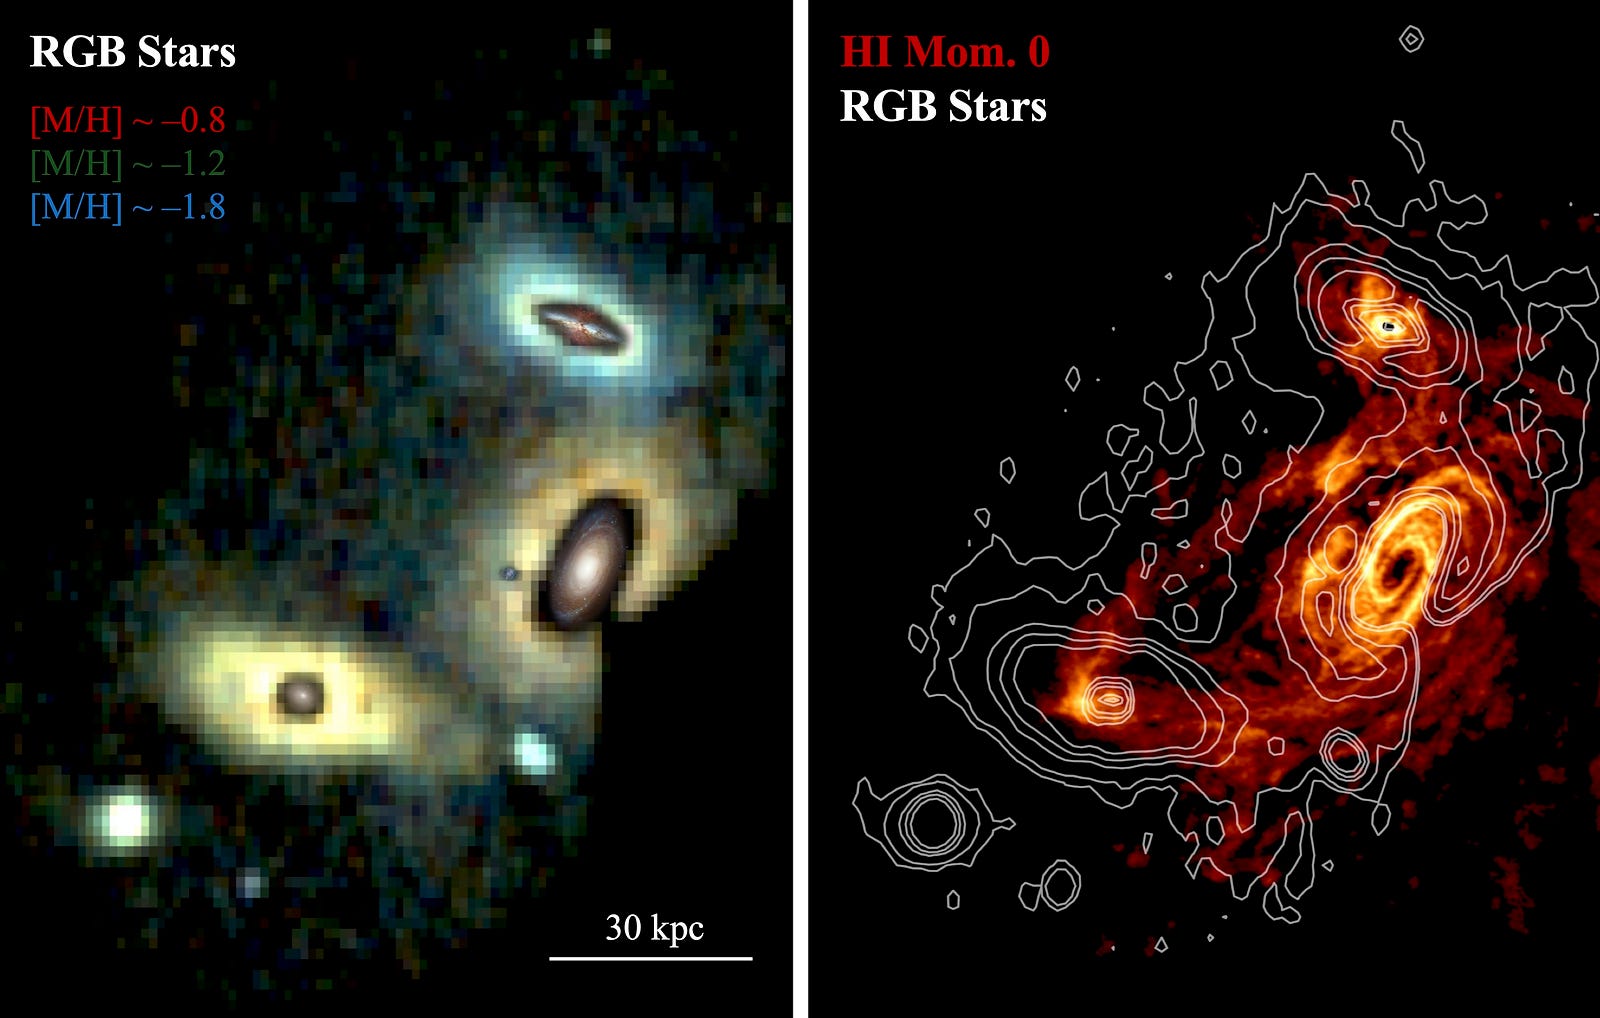
The M81/M82 group of galaxies with Red Giant Branch stars distribution on the left and their densities overlaid over the gas distribution on the right.
A prime example is the M81 group. A trio of galaxies with a lot of material in between, both stars and gas (see above). With Subaru’s camera at this distance, one can identify individual stars in this group, especially well outside the galaxies themselves.
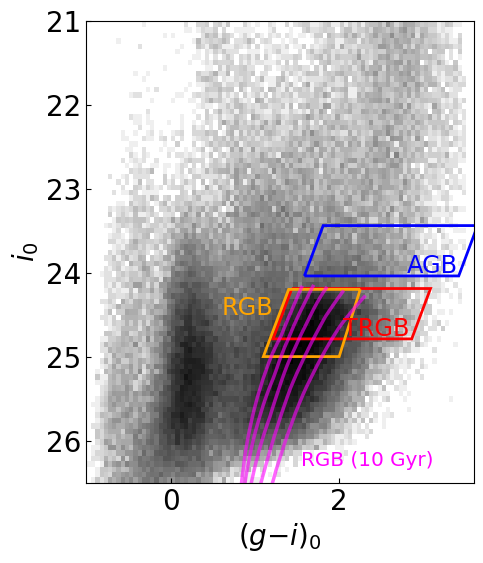
The color-magnitude diagram of stars in M81/M82. There are Red Giant Branch (RGB) and the Tip of the Red Giant Branch (TRGB) and above that, the brigh Asymptotic Giant Branch (AGB) stars.
The individual stars can be identified and so one has a brightness and a color if there is more than one image. In the above figure, you can see how different groupings of stars are visible: Red Giant Branch (RGB) and Asymptotic Giant Branch (AGB) stars. To the left (bluer) is the Main Sequence (so named because it is the main feature but not a sequence) of all the bright stars. The RGB is especially useful. Red Giant Branch stars track the total stellar mass pretty well. The top of it is well defined so it is a great distance indicator. The mix of AGB and RGB is a good indication of overall age and the slope of the RGB branch is an indicator of metallicity. So distance, mass, metallicity and rough age. That is a lot of information of any section!
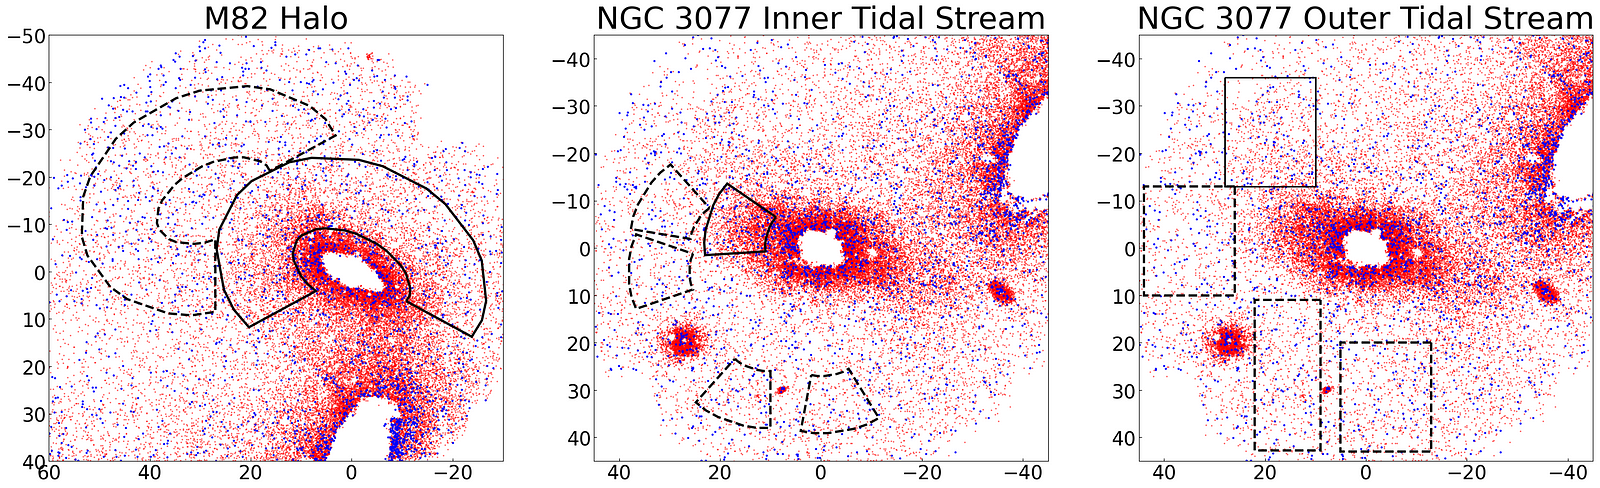
So you can define areas in the group to correspond to clean sections of halo, streams of stars from accretion and interaction etc.
The sections of the image corresponding to halo and two streams.
Generate the color-magnitude diagrams, compare those to models and trace the components back into time.
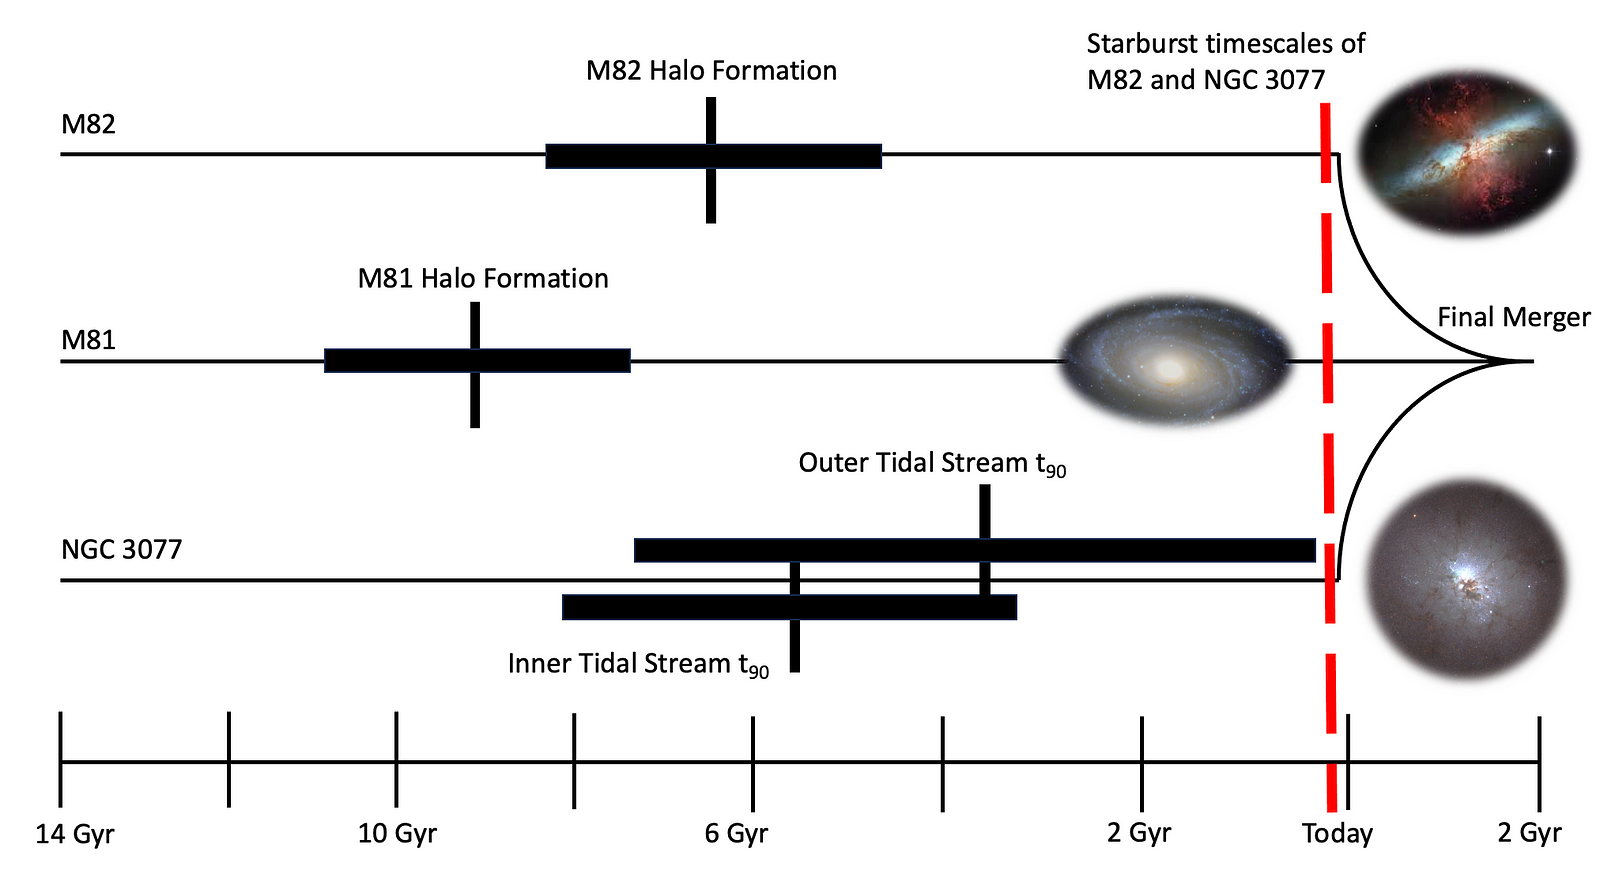
Then we get to the neatest image of this paper: a history of this group with a future prediction. I love timelines and this is such a neat visual way to show how the ages fit together in the evolution of this compact group of galaxies:
The timeline for the M81/M82 group. With the future final merger predicted!
And there we have it. M81’s halo formed first, then M82’s, followed by two tidal events resulting in streams which eventually will be that all of these galaxies will coalesce in some two more Billion years. A bit long to wait around but the finl stretch in terms of the ages in this group.
Neat result by very neat people I collaborated with as part of the GHOSTS collaboration (doing the stellar population thing but with Hubble). It will be really interesting to see what all we can learn from Euclid and Rubin stellar populations of nearby haloes!
Recently, I wrote about merger identification using photometric redshift and how close pairs are a good indication of a rate mergers between galaxies occur at any given epoch of the Universe (see the article here).
And I discussed that there are more ways that one could identify ongoing mergers, most notably from the fraction of galaxies that look ``perturbed’’ i.e. disturbed gravitationally by one of their neighbors. Or just past the point they swallowed a neighboring galaxy.
This was the point of the paper I will be writing about today:
CEERS Key Paper. IX. Identifying Galaxy Mergers in CEERS NIRCam Images Using Random Forests and Convolutional Neural Networks
As you can see from the title, this is a machine learing paper. We also did this the old-fashioned way: asking the whole team to *look* at images and classify. Got to get your training, testing and validation set somehow. Neat thing with this paper is that we used simulated galaxies (we know the truth if they will merge or not) as the training sample.
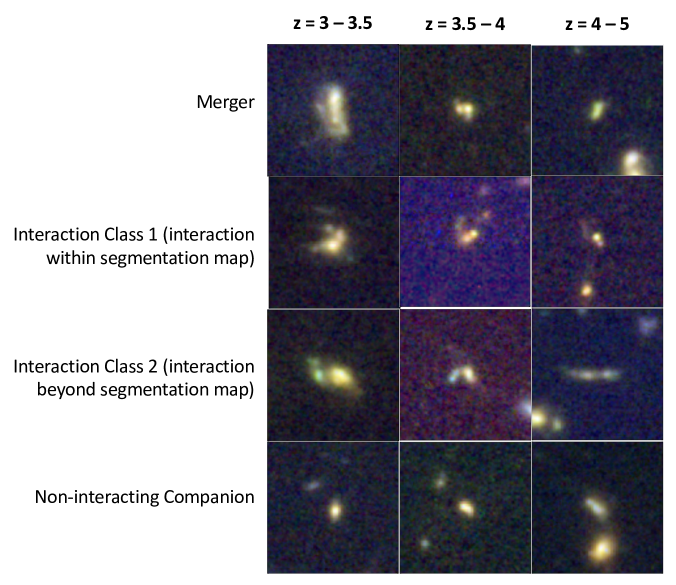
This is the kind of interactions we were looking for: active merger with two galaxies coalescing into one object, visibly still separate but connected objects, two separate objects that have some dark sky between them, and a non-interaction companion (future merger? maybe)
The kinds of merger classifications for the visual classification. These are quite clear for these distant redshifts thanks to JWST NIRCam resolution.
The neat thing about this paper is that we tried several different techniques, including classical ``morphometrics’’ (the shape and appearance of galaxies cast into a series of numbers, I’ve been trying to get everyone to call the ``morphometrics’’ since I think it’s a cool word but at this point I am trying to make ``fetch’’ happen.)
Back to the paper: we tried
morphometrics
a random forest classifier (classic Machine Learning)
a convolutional neural network
This is mostly a machine learning paper so I will go with those first:
Random Forest
This is where you combine a series of ``decision trees’’ (basically a series of yes/no questions to end in a branch (or leaf) of the tree that corresponds to a certain class. Train on your training set, identify which leaves hold merging galaxies, and voila a classification. Don’t like a single tree? Use a bunch of them (computationally cheap) and then average them out: your random forest. This is the algorithm that you apply first. If that doesnt do a so-so job, rethink your input data.
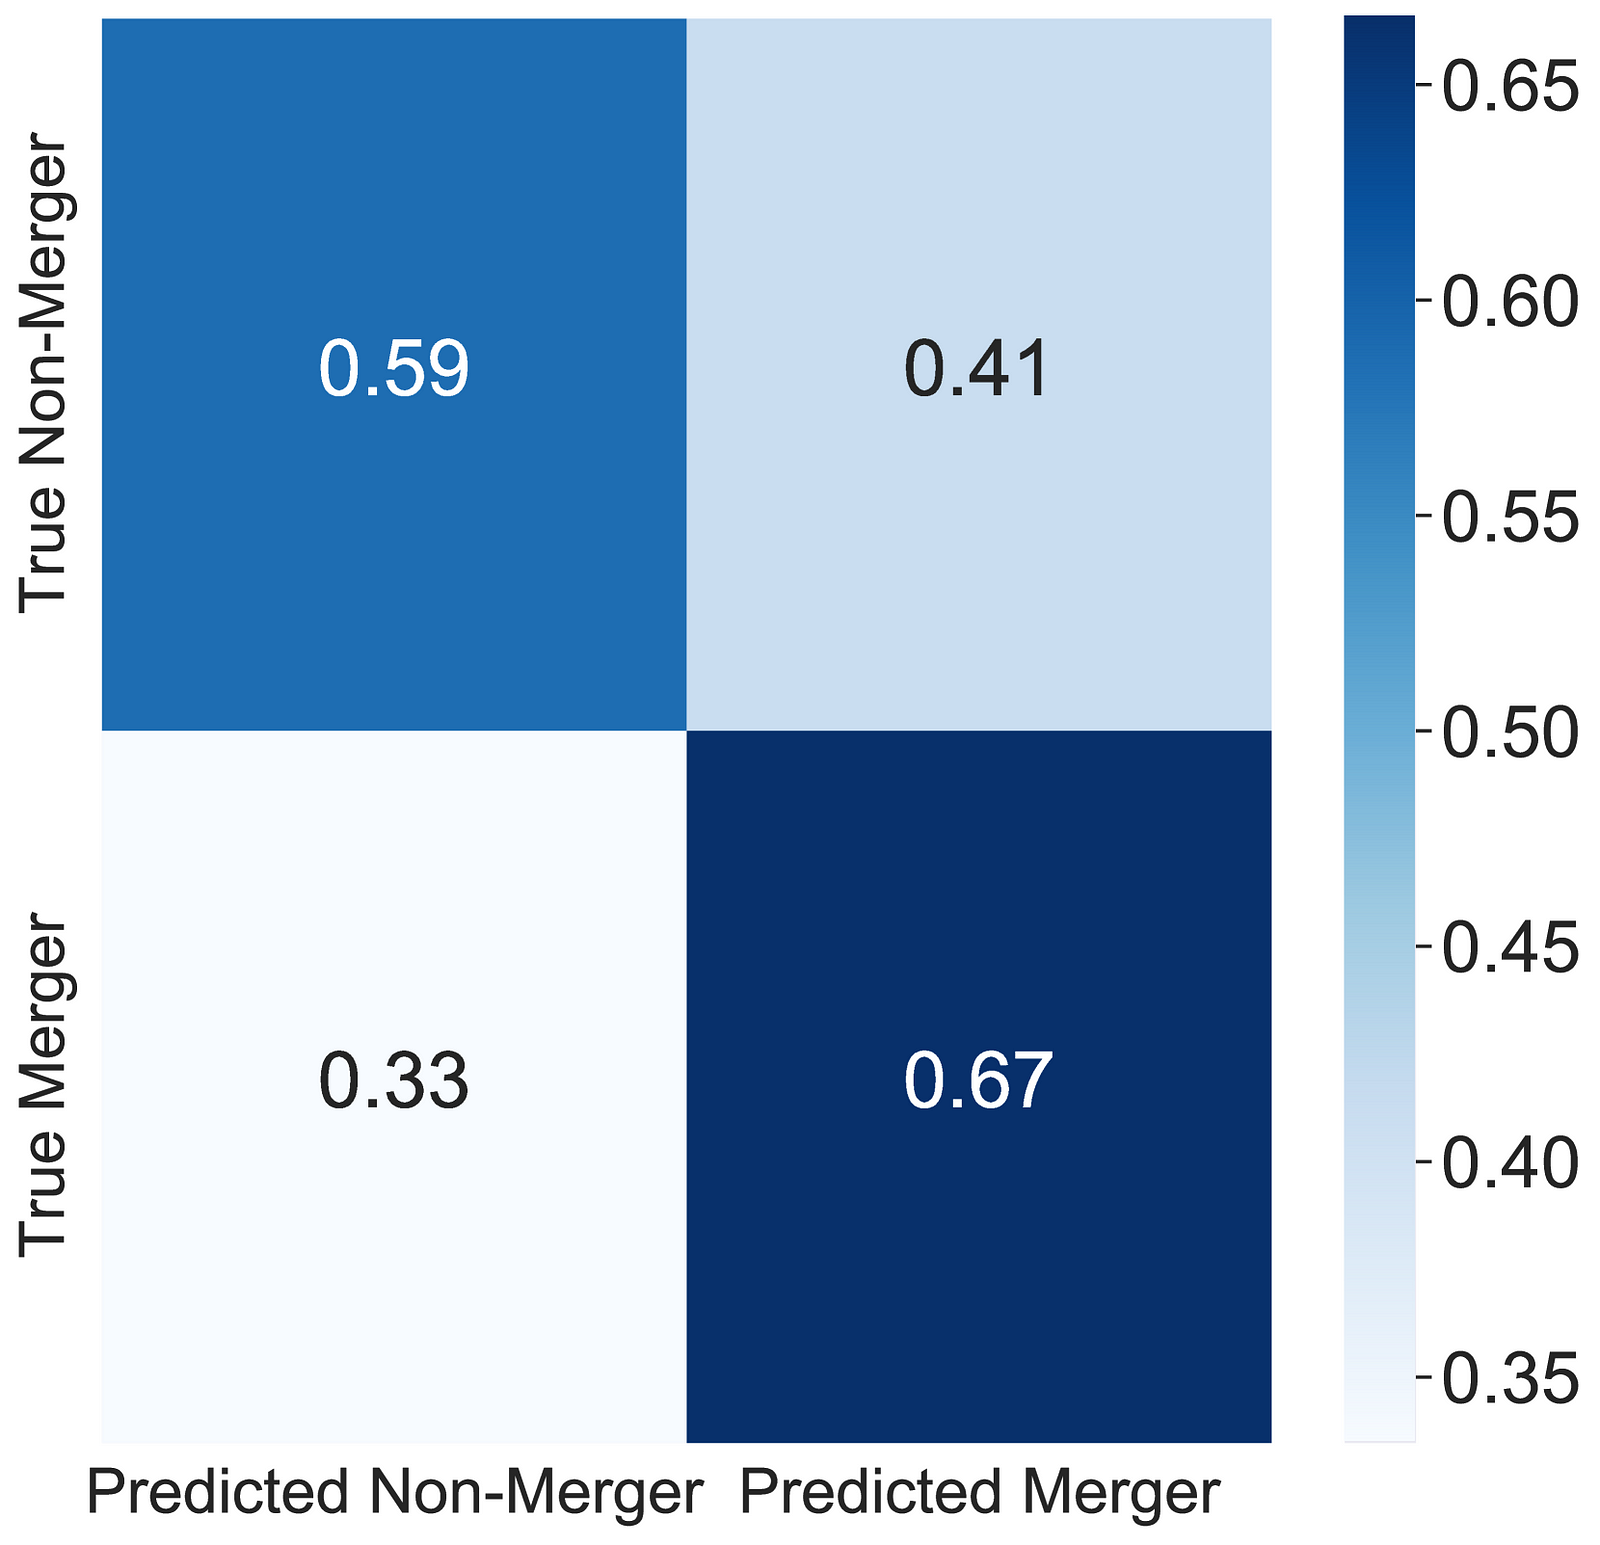
So how did it do?
The random forest classification with predictions on the x-axis and real classifications on the y-axies. Ideally everything sits on the diagonal of this “confusion matrix”.
Not too bad, not really time to stop either. This is more called ``proficient’’. You wouldn’t trust a spellchecker that got it wrong 33% of the time right? We can do better. But it is fair bit better than a random guess.
DeepMerge CNN
In a convolutional neural network, you can use the cutouts from the JWST NIRCam images directly as input. These are then convolved (run through a series of filters like edge-detection etc) and then weighted in a few layers of neurons to produce a merger y/n? answer. Again train on the training set, test and validate.
The confusion matrix at the highest redshift for the CNN.
As the above confusion matrix show, the perfomance is remarkebly similar to the Random Forest. Huh!
Morphometrics
So this is a Gini-M20 based classification that has a particular part of the parameter space that means it is likely a merger.
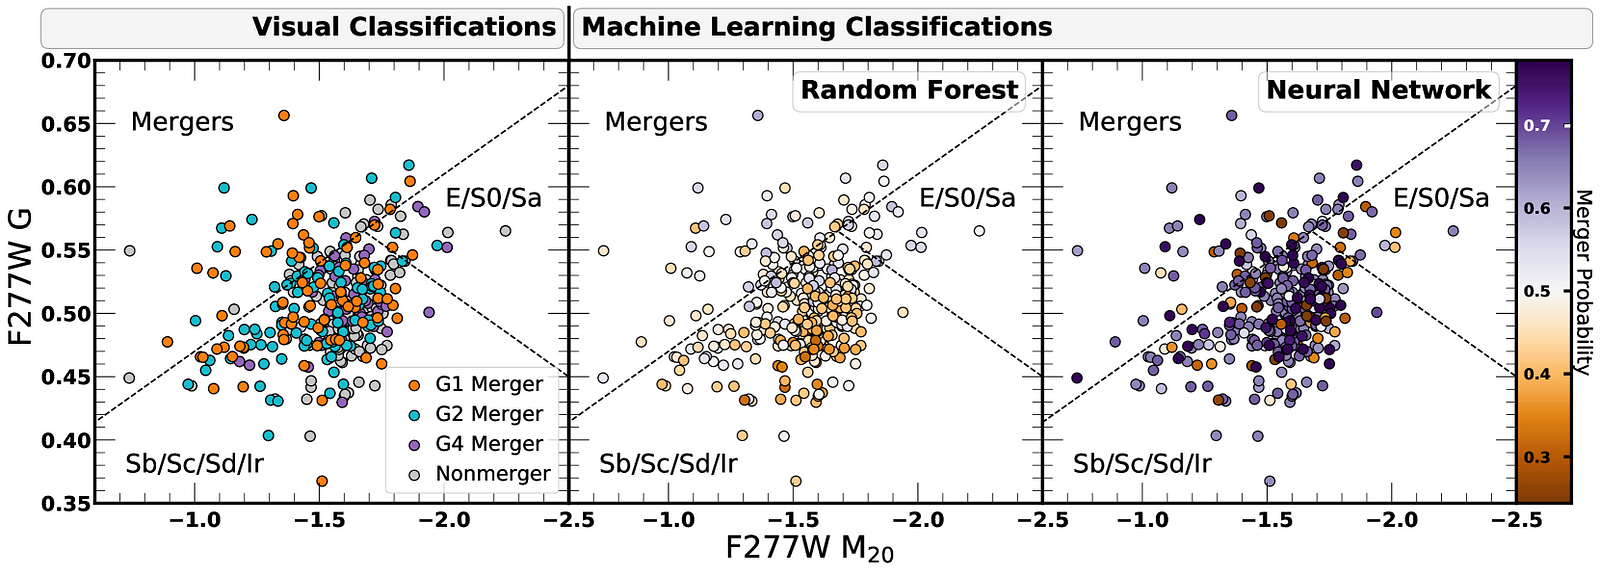
Below are all three classifications (visual, RF and CNN) on the morphometric plane.
The M20-Gini plot with the sections of the plot corresponding to mergers, spheroidals and disk galaxies. And for color the visual classifications, the RF probability and the CNN probability. Each approach has strengths and weaknesses but it is pretty clear that not all merger behave nicely and sit where they are supposed to in this plot.
What we are getting from this paper is that each technique varies drastically on what it considers a merger. We had a very similar experience with morphometrics alone but different surveys or morphometric systems (e.g. CAS vs Gini-M20). Even with training based on simulations (where we know whether a pair is going to merge in the 250 million years, we can just run the clock forward in the computer). Classification like this is hard.
But the good news is that the merger rate inferred at different redshifts is fairly robust and agrees between the techniques.
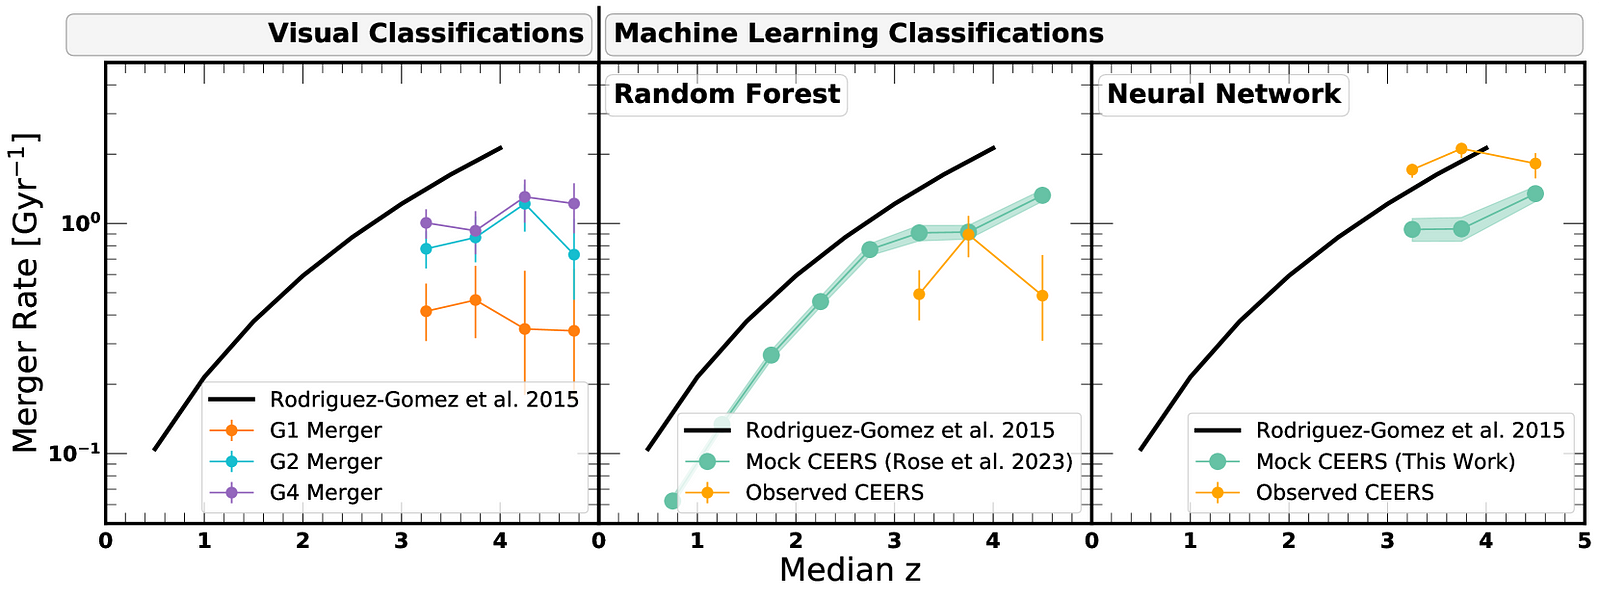
The merger rate (not fracton) of galaxies with redshift.
We are still a ways away from being able to classify individual galaxies on whether or not they’ll merge (definitely in the next Gyr this one) but the fraction and the rate at which the population is merging, that seems pretty robust. I expect that a lot more work will go into galaxy morphology of merging galaxies in the near future with more JWST data and the Euclid Space Observatory now both in full science mode. More and exciting machine learning applications are yet to come!