Friday, July 26, 2024

EPOCHS-I photometric redshifts for James Webb Space Telescope deep fields.

 How far away is that? A simple question that has a lot of implications for anything in the night’s sky. As soon as you leave our own Galaxy however, it makes more sense to talk about redshift (z), the amount the light has shifted to the red due to the expansion of the Universe. In extra-galactic astronomy, this is what we use in lieu of distances. 

We never express it in lightyears. 

There are two major ways to determine the redshift o galaxies far far away (I mean I had to say that there). First is to take a spectrum and identify a spectral feature (bright emission lines are great for that). This allows you to measure how much that line or feature has moved to a longer (redder) wavelength very accurately. This is the best way and the most expensive way.

If the galaxies are too faint and/or there are a lot of them, getting a spectrum may not be the best option. So we use the colors of galaxies to find the redshift: the more colors, the more accurate the distance. Especially if there is a clear change in the spectrum of the galaxies — a break — allows one to get a pretty good redshifts. More colors is better, it works better for some redshifts than others. This is called photometric redshifts and they are a lot cheaper observationally since you need to take a picture anyway, why not add a few colors? 

Most of the time spectroscopic and photometric redshifts agree quite well. In the paper this week, there is this check:
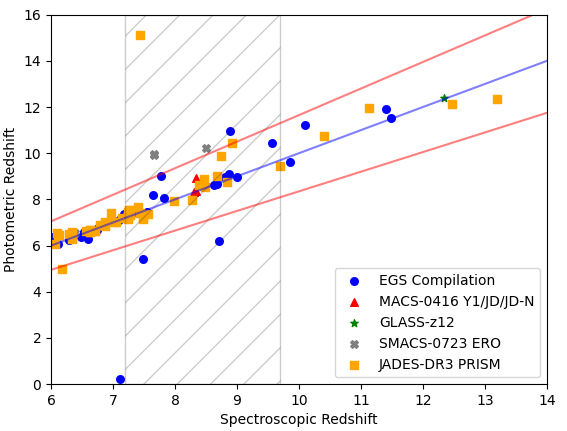
The comparison between spectroscopic and photometric redshifts. The blue line is perfect agreement. A few points are completely off, but most agree pretty well.

And this is the paper I am talking about that appeared this week:

This is the first of the EPOCHC papers, a project led by Chris Conselice using all the public JWST data and using them in a consistent way to get distances from the photometry. At highr redshift, the photometric redshifts get a boost from the Lyman-break, a point where all ultraviolet light is absorbed by the gas between us and the galaxy. There is light redwards of that break and none on the blue side. That sharp edge narrows the photo-z solutions nicely.
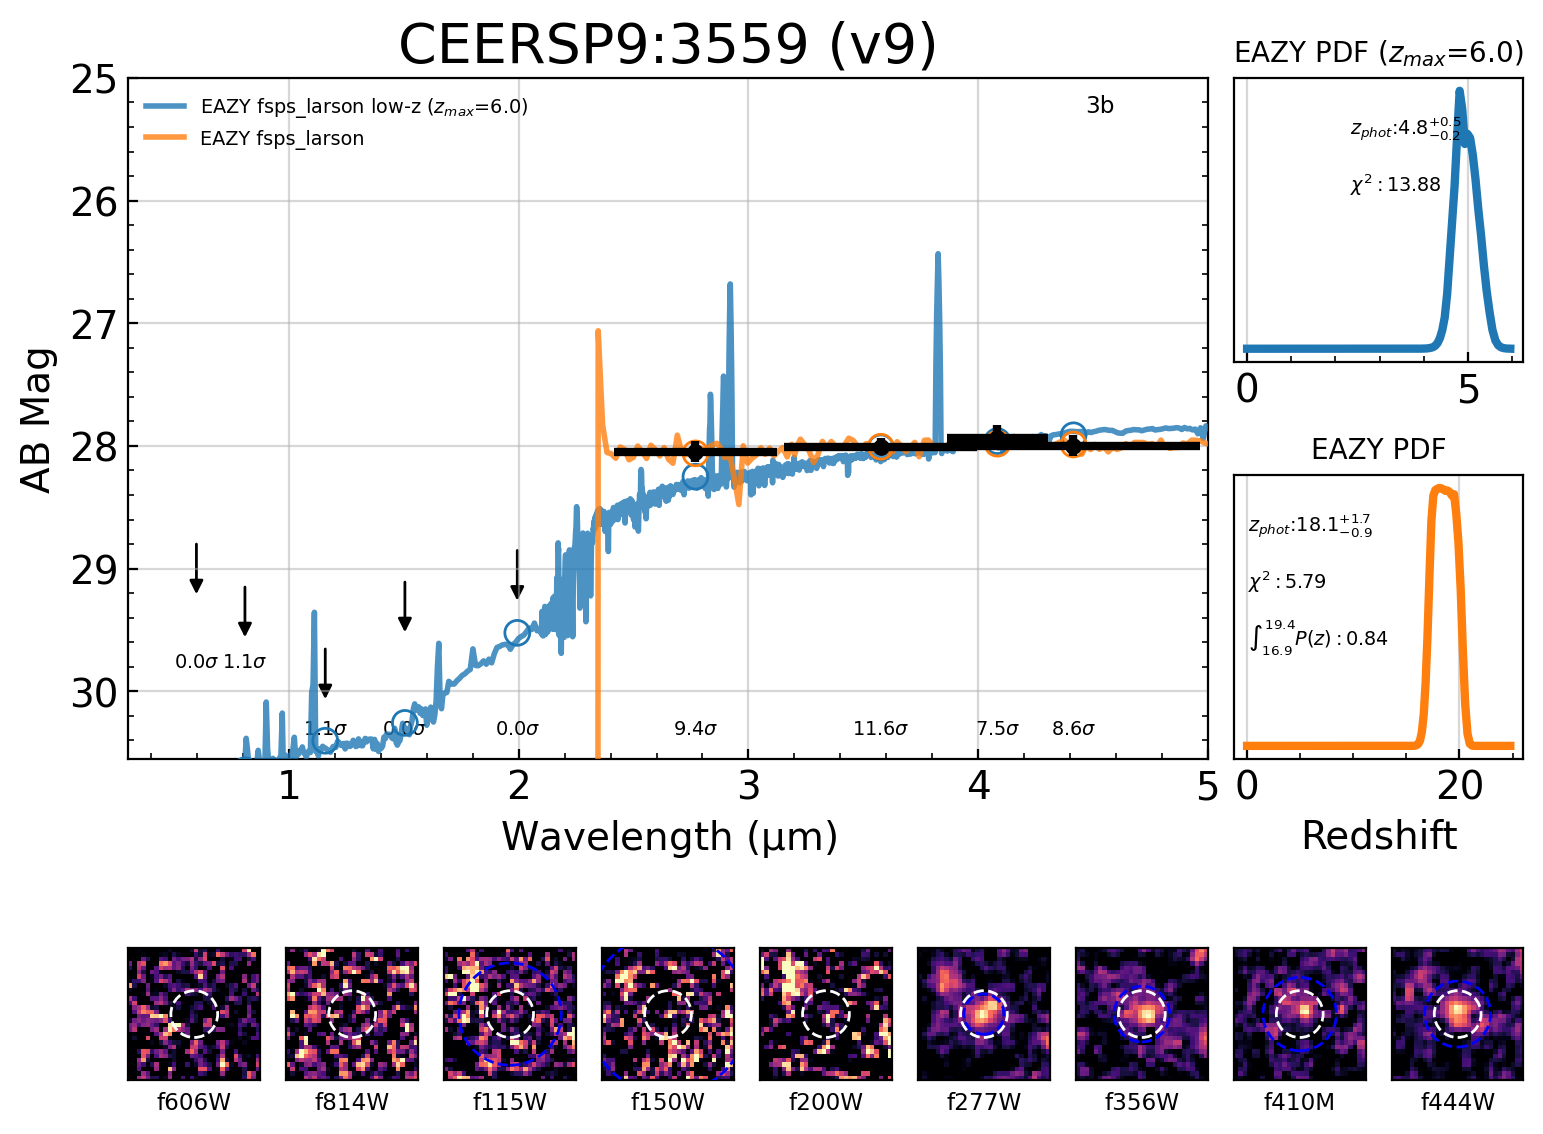
An example from the paper of a Lyman break galaxy. There is a pretty clear break between 2 and 3, meaning the galaxies is observed only in the red filters (postage stamps below the figure). 

The compilation is a neat way to explore where these most distant galaxies have been found and where. 

It shows very well how hard it is to get galaxies above z=10. It is still amazing we do at all! Z~10 was the limit for Hubble and we really only found one! JWST is really delivering here. 

The next steps will be exploring this population of high-redshift galaxies. As you can imagine from the title, this is only the first of the EPOCHS papers with many to follow using the data compilation and redshifts presented here. 
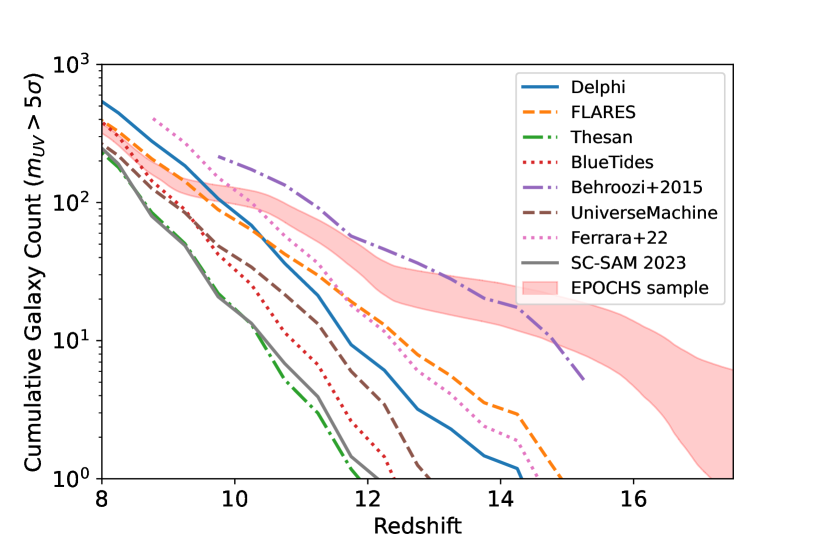
The number counts predicted from a series of simulations (lines) and the observed numbers in EPOCHS (light red shaded area). The numbers in EPOCHS are higher than most models would have predicted.

We are in trouble a little here: the models made based mostly on HST observations predicted a rapid increase of the number of galaxies. But as the figure above shows, there were many more galaxies already in place. This is causing a bit of a stir on galaxy formation models since how do you do that? There isn’t that much time to pull these galaxies together between the big bang and when we see them. The Universe assembles these fast! 

It was really fun to be involved (tangentially, the main author did all the work, I shout encouragement from Kentucky as is usually my role) with this paper. I have been part of the PEARLS and CEERS teams for the past year and a half and the road of discovery, and the mode of new science is just fantastic. 

Much more to come. In a next post! 

Friday, July 19, 2024

Galaxy Merger Identification

Some good news and some bad news: first the bad, our Milky Way is going to hit the Andromeda galaxy in the future. The good news is that it will be so far off in the future, there is no need to add it to your calendar. But it will mess the Milky Way and Andromeda up. No more spiral galaxies but one big elliptical is the prediction. 

Galaxy collisions are a major renovator of galaxy populations. We’ve suspected it, we have seen examples. The question remains: how often do they happen and how much of an impact. And that is where galaxy evolution and statistics come in. The further we look back in time, and the more red our observations, the better we can estimate how many mergers are happening at any time during the age of the Universe. 

How to do so is weirdly harder than it sounds. It’s a collision between two Milky Way sized things! How do you miss that? Quite easily as a matter of fact: they hardly look perturbed until the moment of close encounter. 

There are two major techniques to identify merging galaxy pairs: first by identifying pairs of galaxies close enough together that they will likely merge. Benefits are that you can set strict thresholds, motivated by merger simulations. No do they or don’t they. The drawback is that you need an accurate distance. Lots of galaxies are close together on the sky but completely separate along our line of sight. SO accurate distances are the name of the game.

The other major technique looks for a perturbed looking fraction of galaxies. These rely on morphology indicators to identify off-looking galaxies. This can be a little subjective as you can imagine. As much as we have tried to quantify morphology of galaxies, it really depends on the wavelength observed (and originally emitted) and what “perturbed looking” really means. It also means your technique is only sensitive to much closer encounters or even the aftermath.

Enter JWST. Now in the near-infrared, we can examine galaxies in the light they emitted in the optical all the way back to redshift z=5 so most of the history of the Universe. Direct comparison with the local examples! 

The paper that appeared this week that I was on used the first technique however! Pairs of galaxies! Using a very clever pairing with the photo-z distances. If there was a clear overlap, it was a pair! 


The probabiity density function of the redshift of two nearby galaxies (at redshift 6!!) and with the probabilities overlap enough to constitute a pair.
A second pair at almost redshift 6 but the overlap between the probability density function is near zero, not a pair, even though they look close together on the sky!

So with just photo-z redshifts, one can create a pair catalog. At a given redshift, you can now reasonably say what fraction of galaxies is undergoing a merger (likely in the next few giga-years aka billions of years). 

The merger fraction as found in this new paper. And all the measurements preceding it also added. This is a great strategy for any student or postdoc, show everyone else’s work too, see where yours fits. Overview result plots like these get used in presentations (and blogs or Medium articles).

That gives us an idea how many galaxies are typically getting ready to merge. But how fast is that happening? Is it so slow that the fraction we saw at redshift 4 (12 BILLION years ago) are still going at it? One needs an idea of a timescale to convert it to a merger rate.

The merger rate for galaxies as a function of redshift (and age of the Universe).

This last figure has done exactly that: converted the fraction to a merger rate. And the merger rate in the early Universe is much higher than it is now. It is pushing a few per Gyr! By the time we get to the Milky Way and Andromeda (the here and now) it happens maybe every 100 Gyr? 

There were a lot of things to check for this result and the main author Qiao Duan has done a fabulous job of it. It is all clearly laid out and explained. I contributed some minor feedback. Neat paper, just shows what we’ll learn with JWST.


Monday, April 10, 2023

E-mail Scourge

I am on sabbatical. I had not quite appreciated what all I can do while on sabbatical. A big goal was to organize. Mess and clutter, digital or otherwise are sources of stress and I wanted to remove some. 

Last week I was offline (well mostly, please clap) and I let all the email pile into the respective email boxes. Email is a terrible way to do certain tasks and yet Universities etc have decided that all communication will be over email. So having a view of what all comes in during a given week was illuminating. 

The vast majority are FYIs from automated lists. 

The majority of which I rarely actually need to read. All I do is file/archive them. Informational content is almost zero. 

Time to employ filters. This was the goal of the exercise. What emails can I safely filter? Most.

Improving my email signal-to-noise was one of the goals. Organize the folders various things go into. And I am adding relaxation to my post-vacation state. Email creep will happen again. But being offline nicely shows what can be filtered and what has actual informational or actionable value. 

Time to email collaborators ;)


Thursday, June 9, 2022

Mode of transport


I’m one of nature’s bike commuters. Of course growing up in the Netherlands this is a lot easier. There is infrastructure for that. You can pedal and think and honestly not pay that much attention to your surroundings. You know. Commute. 


I commuted by bike in Baltimore, South Africa, and to ESA and Leiden observatory. 


I haven’t commuted to work on a bike even once here in Louisville. 


I mapped it out before moving here, the university has a bike encouragement program, the bus has bike racks up front. Why not?


And that’s what I’m wondering about. First off is much less infrastructure for biking here but that did not stop me before in the US. I suspect it’s also the pressure from work as a professor. And there was a lot of that. A LOT of the work is instantly forgettable admin churn. And there is so much of it. 


I can do email triage etc on the bus so I did that a lot. And twitter of course. Gotta twitter. Otherwise I’d have a moment of mindfulness. 


But then the pandemic hit and I just took a car to work because who else was going anywhere? And the habit stuck. And then kid 2 had to be collected from school 1 while kid 1 had to be collected from school 2. And so on and so forth. But do I really need to do this? Kids can take busses to school again. And I can move back to the bus or possibly…maybe…bike there?  A colleague biked in the other day. I should try. And another colleague has started researching e-bikes. 


The second car is now old enough to qualify as a “historical vehicle”. Maybe it’s time to reconsider the bicycle for the commute. Just wish my class didn't end at 7pm. 


UPDATE: I did bike in! This was the proof-of-concept. Didn't die. Of traffic or heatstroke. But it does feel like a thing an e-bike would be very nice for. 

Wednesday, April 13, 2022

Visit to STSCI

This week I got to visit STSCI, one of the most formative places for my scientific career. The idea that science is for everyone, data should be available and easily accessible, my philosophy on working with students etc etc all can be traced for a large part to my 6 years (2000-2003 and 2005-2008) I spent there.


It was a very warm welcome. It was ridiculously good to see so many science collaborators and friends. All of whom have of course not aged a bit and are still very much amazing.


I had to endure some genteel ribbing about not taking the job there 5 years ago. Fair enough. And I had to remind me that the giddy atmosphere has a lot to do with the ridiculous good performance of JWST after a flawless launch and that I was the second in-person speaker. People were happy to see me and just happy to see each other and science together. 


So I am planning a second visit where I can calibrate the emotional vibe of this one. 


I tallied up all the stuff kicked around. A dozen paper ideas (not all are going to make it because there is only so much time in the day) and half a dozen telescope proposal ideas for the coming year. Oh yes, sciencing in person is frikkin awesome!


Monday, March 28, 2022

The Deadline Game

Deadlines are a thing in astronomy. There is always one on the horizon. Telescope time, grants, more of those. Rinse. Lather. Repeat. 


A big part of becoming an effective professor is to deal with them. And I do not deal well with last minute frantic editing. The kind that much of academia seems to thrive on. I cannot proofread or edit effectively that way. And stress messes me up (small infections, poor sleep, mental health effects etc). 


So start on time. The favorite thing professors tell their students. And I did. I wrote a first draft of several Hubble proposals months ahead.  When I had the first idea. AND I decided against several. So start early and NOT do some. Only way to scope out a reasonable week before the deadline. Trick is often for me it’s not just time but also energy. I had a spring break and I got a bunch of stuff done in it and rested up. But it’s a fine line. And I was still pretty stressed. There are little tells (see above). 


But once again it’s done. Managed not to think how much is riding on successful proposals (me getting paid over the summer, students actually doing Stuff) and just gushed about how fun the science will be. 

Tuesday, March 8, 2022

Tenure File Mental Notes

 Ok so I am procrastinating on working on my tenure file. A little.


Here are some of the thoughts I had while I was putting this together. There is little to no clear guidance and a lot tends to change when the next Dean in charge of the process rotates in or another “system” is adopted. This is to be expected. Nothing is set in stone and if, for example, not having all your publications loaded is fine, it could be dropped. 


  1. Have a google drive or dropbox or something that is on the cloud and on your computer and organize EVERYTHING in there.
  2. It’s ok to rename things. I am liberally renaming files to more legible titles that are descriptive. Why? Because no one is reading this whole thing.


No one. Make it easy to skim.


  1. Make a little note explaining what this giant list of files is. Explain acronyms etc. I keep adding more. And this is what MNRAS stands for. 
  2. Everything goes into the cv. I did not fully appreciate that. Send it to your HoD. There is a thing that all the different levels expect. Check with those experienced with the process. 
  3. Hey do you have a summary sheet or something that HR made? Check if it has your birthday and/or social security information on there. No need for ID theft...
  4. There is going to be a time-wasting thing. Possibly linked to point 4 or 2 or 7. There is some task that feels insulting and grinds in that last exposed nerve you have left at the end of the process. There it is. Expect it. It may well be yourself who is making you do it. 
  5. Completeness is great but it’s more about box checking. You should have something in every category. It’s nice if you have everything but it’s ok if you miss that committee you were on for a week four years ago. 
  6. Use the official PDFs of your publications. I had quite a number of preprints initially because working from home but I took the effort of downloading the full in-print versions and replaced them. Looks much better but also has the DOI numbers on them. 
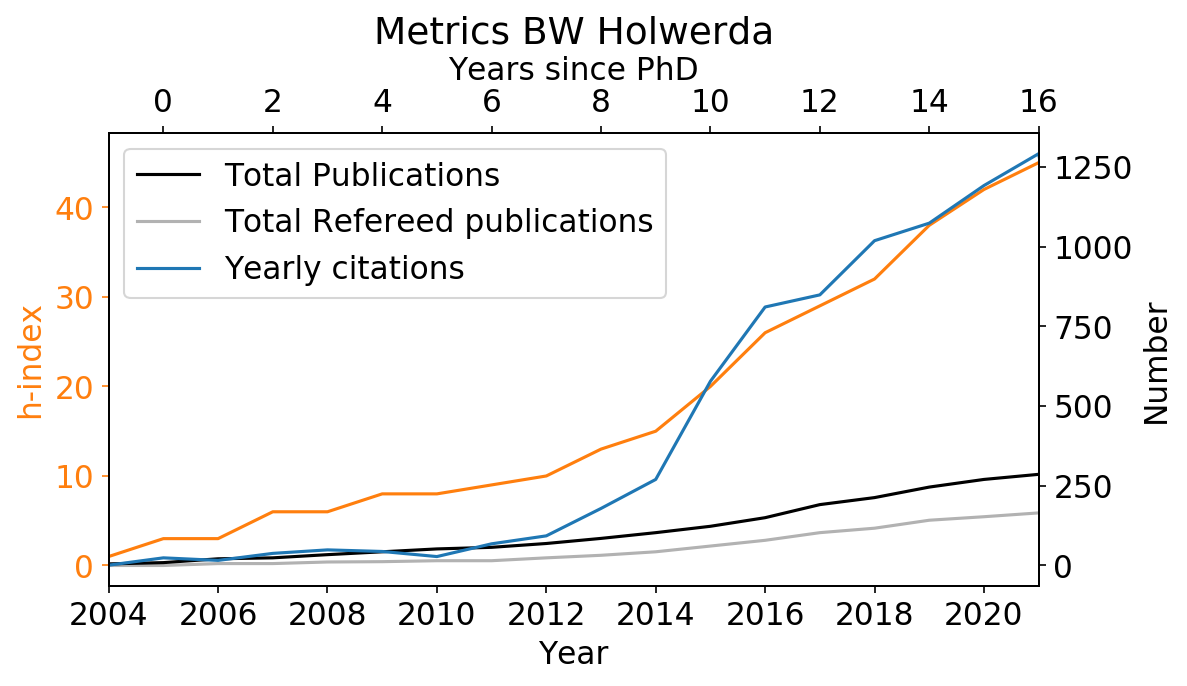
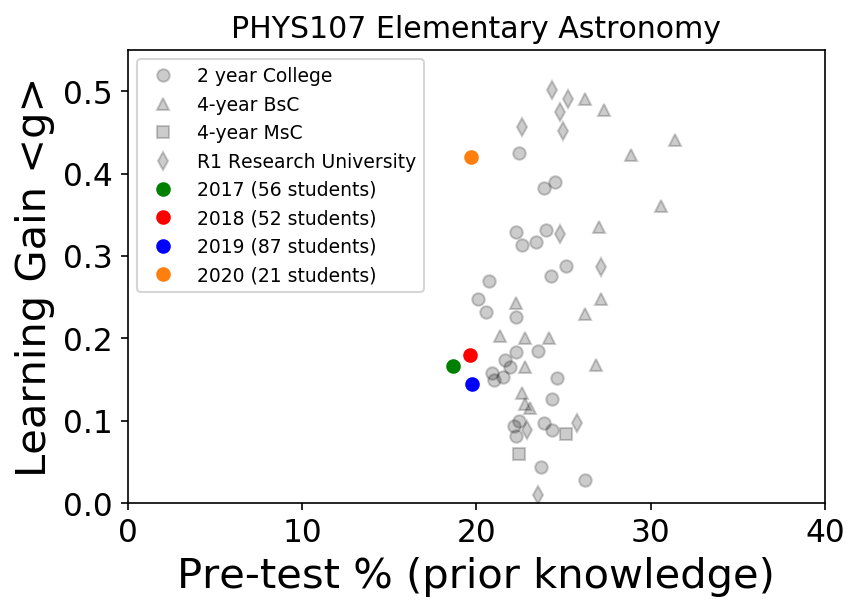
  7. Summarizing plots. I made a plot with h-index, number of citations, number of papers etc etc. All lines racing higher.  It’s meaningless of course but looks impressive. Pre/post improvement of undergraduate in my astro class. Pretty picture of Hubble release and one of my book. 


Doesn’t that tell you I’m solid researcher and teacher? Sure it does.