Friday, July 26, 2024

EPOCHS-I photometric redshifts for James Webb Space Telescope deep fields.

 How far away is that? A simple question that has a lot of implications for anything in the night’s sky. As soon as you leave our own Galaxy however, it makes more sense to talk about redshift (z), the amount the light has shifted to the red due to the expansion of the Universe. In extra-galactic astronomy, this is what we use in lieu of distances. 

We never express it in lightyears. 

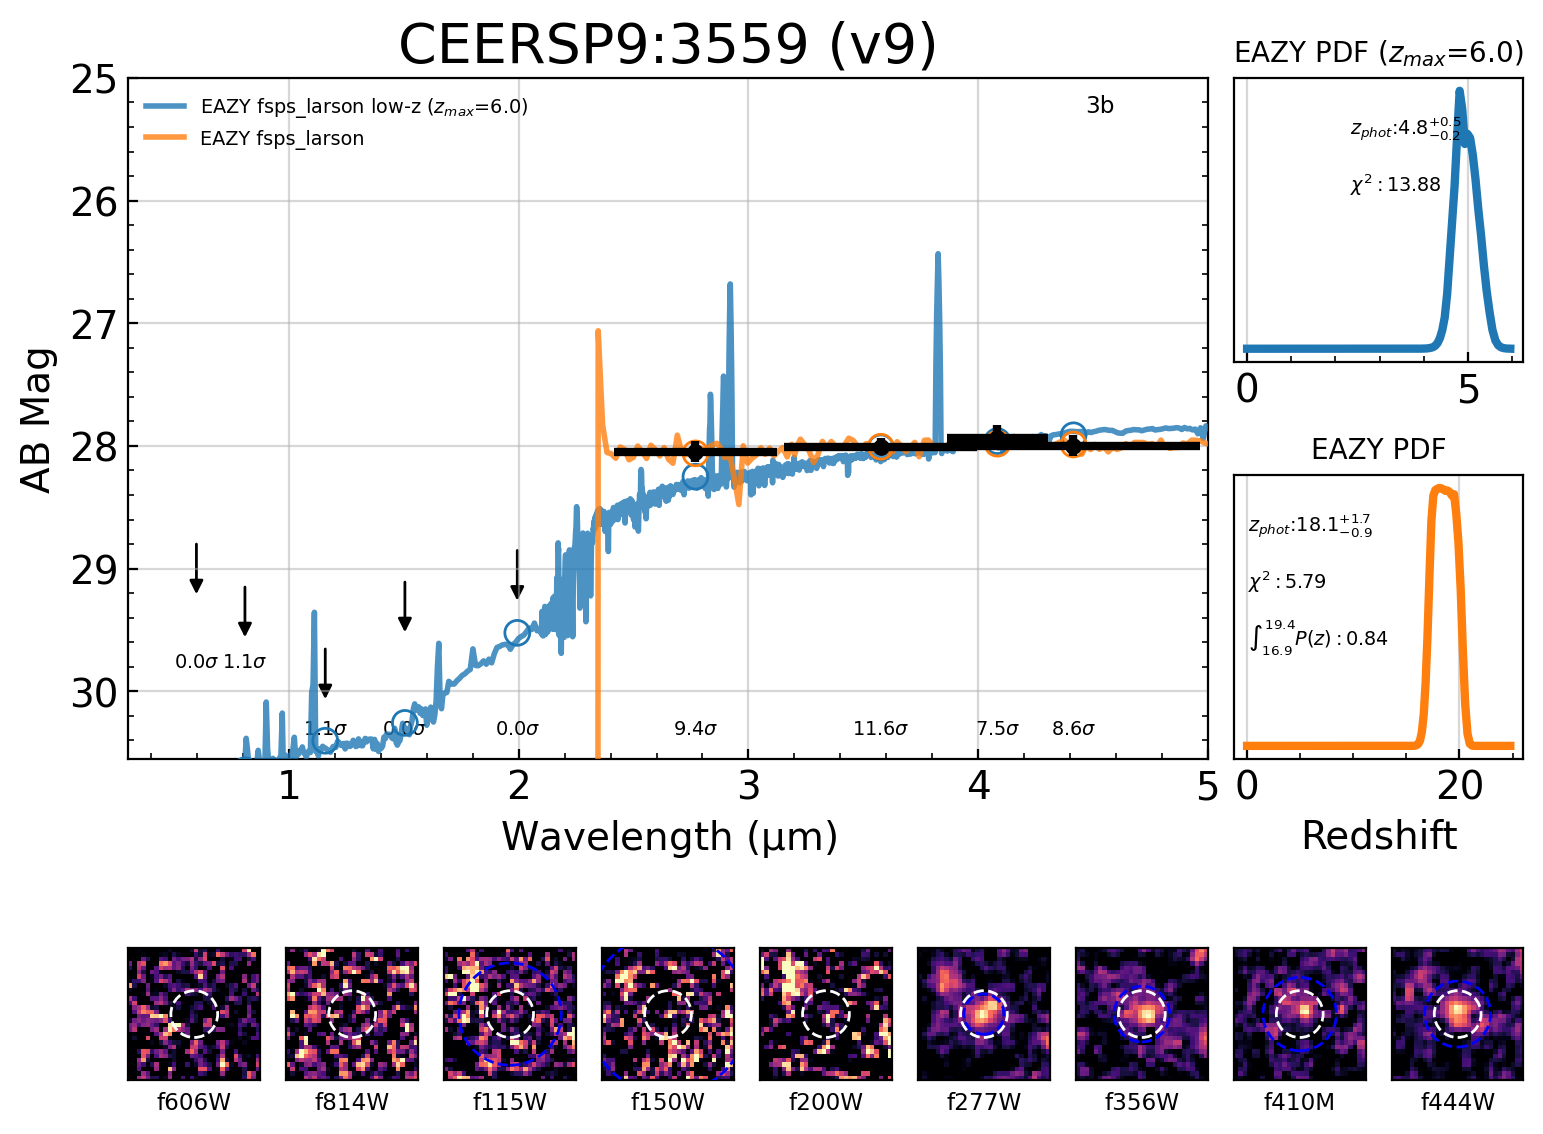
There are two major ways to determine the redshift o galaxies far far away (I mean I had to say that there). First is to take a spectrum and identify a spectral feature (bright emission lines are great for that). This allows you to measure how much that line or feature has moved to a longer (redder) wavelength very accurately. This is the best way and the most expensive way.

If the galaxies are too faint and/or there are a lot of them, getting a spectrum may not be the best option. So we use the colors of galaxies to find the redshift: the more colors, the more accurate the distance. Especially if there is a clear change in the spectrum of the galaxies — a break — allows one to get a pretty good redshifts. More colors is better, it works better for some redshifts than others. This is called photometric redshifts and they are a lot cheaper observationally since you need to take a picture anyway, why not add a few colors? 

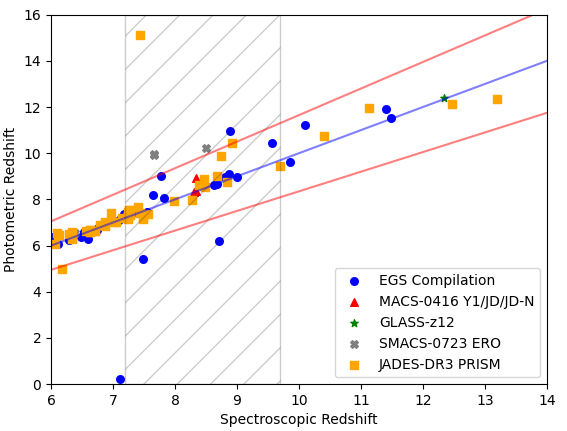
Most of the time spectroscopic and photometric redshifts agree quite well. In the paper this week, there is this check:

The comparison between spectroscopic and photometric redshifts. The blue line is perfect agreement. A few points are completely off, but most agree pretty well.

And this is the paper I am talking about that appeared this week:

This is the first of the EPOCHC papers, a project led by Chris Conselice using all the public JWST data and using them in a consistent way to get distances from the photometry. At highr redshift, the photometric redshifts get a boost from the Lyman-break, a point where all ultraviolet light is absorbed by the gas between us and the galaxy. There is light redwards of that break and none on the blue side. That sharp edge narrows the photo-z solutions nicely.

An example from the paper of a Lyman break galaxy. There is a pretty clear break between 2 and 3, meaning the galaxies is observed only in the red filters (postage stamps below the figure). 

The compilation is a neat way to explore where these most distant galaxies have been found and where. 

It shows very well how hard it is to get galaxies above z=10. It is still amazing we do at all! Z~10 was the limit for Hubble and we really only found one! JWST is really delivering here. 

The next steps will be exploring this population of high-redshift galaxies. As you can imagine from the title, this is only the first of the EPOCHS papers with many to follow using the data compilation and redshifts presented here. 

The number counts predicted from a series of simulations (lines) and the observed numbers in EPOCHS (light red shaded area). The numbers in EPOCHS are higher than most models would have predicted.

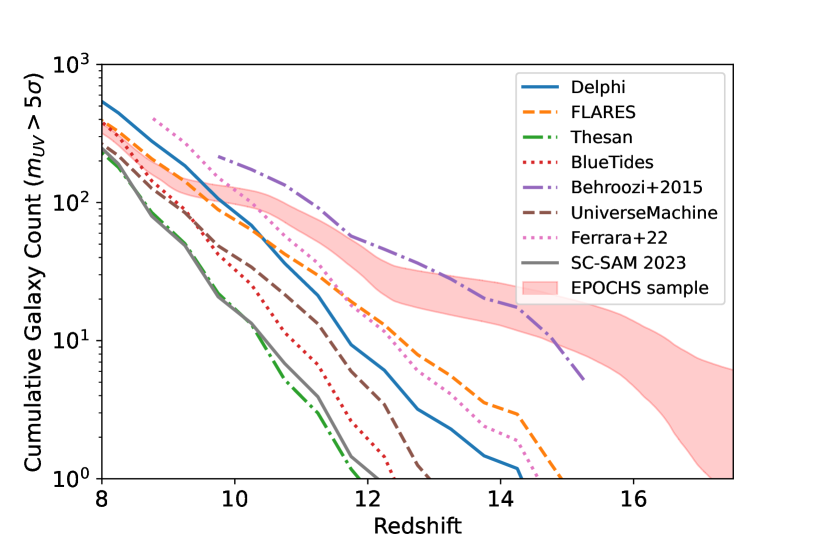
We are in trouble a little here: the models made based mostly on HST observations predicted a rapid increase of the number of galaxies. But as the figure above shows, there were many more galaxies already in place. This is causing a bit of a stir on galaxy formation models since how do you do that? There isn’t that much time to pull these galaxies together between the big bang and when we see them. The Universe assembles these fast! 

It was really fun to be involved (tangentially, the main author did all the work, I shout encouragement from Kentucky as is usually my role) with this paper. I have been part of the PEARLS and CEERS teams for the past year and a half and the road of discovery, and the mode of new science is just fantastic. 

Much more to come. In a next post! 

Friday, July 19, 2024

Galaxy Merger Identification

Some good news and some bad news: first the bad, our Milky Way is going to hit the Andromeda galaxy in the future. The good news is that it will be so far off in the future, there is no need to add it to your calendar. But it will mess the Milky Way and Andromeda up. No more spiral galaxies but one big elliptical is the prediction. 

Galaxy collisions are a major renovator of galaxy populations. We’ve suspected it, we have seen examples. The question remains: how often do they happen and how much of an impact. And that is where galaxy evolution and statistics come in. The further we look back in time, and the more red our observations, the better we can estimate how many mergers are happening at any time during the age of the Universe. 

How to do so is weirdly harder than it sounds. It’s a collision between two Milky Way sized things! How do you miss that? Quite easily as a matter of fact: they hardly look perturbed until the moment of close encounter. 

There are two major techniques to identify merging galaxy pairs: first by identifying pairs of galaxies close enough together that they will likely merge. Benefits are that you can set strict thresholds, motivated by merger simulations. No do they or don’t they. The drawback is that you need an accurate distance. Lots of galaxies are close together on the sky but completely separate along our line of sight. SO accurate distances are the name of the game.

The other major technique looks for a perturbed looking fraction of galaxies. These rely on morphology indicators to identify off-looking galaxies. This can be a little subjective as you can imagine. As much as we have tried to quantify morphology of galaxies, it really depends on the wavelength observed (and originally emitted) and what “perturbed looking” really means. It also means your technique is only sensitive to much closer encounters or even the aftermath.

Enter JWST. Now in the near-infrared, we can examine galaxies in the light they emitted in the optical all the way back to redshift z=5 so most of the history of the Universe. Direct comparison with the local examples! 

The paper that appeared this week that I was on used the first technique however! Pairs of galaxies! Using a very clever pairing with the photo-z distances. If there was a clear overlap, it was a pair! 


The probabiity density function of the redshift of two nearby galaxies (at redshift 6!!) and with the probabilities overlap enough to constitute a pair.
A second pair at almost redshift 6 but the overlap between the probability density function is near zero, not a pair, even though they look close together on the sky!

So with just photo-z redshifts, one can create a pair catalog. At a given redshift, you can now reasonably say what fraction of galaxies is undergoing a merger (likely in the next few giga-years aka billions of years). 

The merger fraction as found in this new paper. And all the measurements preceding it also added. This is a great strategy for any student or postdoc, show everyone else’s work too, see where yours fits. Overview result plots like these get used in presentations (and blogs or Medium articles).

That gives us an idea how many galaxies are typically getting ready to merge. But how fast is that happening? Is it so slow that the fraction we saw at redshift 4 (12 BILLION years ago) are still going at it? One needs an idea of a timescale to convert it to a merger rate.

The merger rate for galaxies as a function of redshift (and age of the Universe).

This last figure has done exactly that: converted the fraction to a merger rate. And the merger rate in the early Universe is much higher than it is now. It is pushing a few per Gyr! By the time we get to the Milky Way and Andromeda (the here and now) it happens maybe every 100 Gyr? 

There were a lot of things to check for this result and the main author Qiao Duan has done a fabulous job of it. It is all clearly laid out and explained. I contributed some minor feedback. Neat paper, just shows what we’ll learn with JWST.